

 Français
How to Analyze a Balance Sheet Like an Expert in 60 Seconds
Learn how to analyze a balance sheet effectively. Our practical guide explains how to analyze a balance sheet to assess a company's financial health.

Breaking down a balance sheet is a bit like playing financial detective. You’re trying to understand, at a specific moment in time, how a company is really doing. This document, which can seem austere at first glance, is actually a real goldmine. It tells a story: the story of what the company owns (its assets) and how it financed all of it (its liabilities). Learning to read between the lines is the first skill to acquire to run your business or evaluate a partner.
Understanding the structure of a balance sheet: the art of balance

Before diving into ratios and formulas, you first need to absorb the logic of the balance sheet. Picture it as a snapshot, a financial photo. On one side, the assets, which list everything of value to the company, from its machinery to the money owed by its customers. On the other, the liabilities, which explain where the funds used to finance those assets came from.
It’s no coincidence that the two columns always balance perfectly. That’s the fundamental principle of double-entry bookkeeping: every euro invested in assets has its counterpart, its origin, in liabilities.
To make things clearer, here’s a breakdown of the elements found on each side.
The key components of a balance sheet
This table illustrates the fundamental elements of assets and liabilities so you can quickly grasp the logic of the balance sheet.
| Asset Category (What the company owns) | Concrete examples | Liability Category (What the company owes) | Concrete examples |
|---|---|---|---|
| Fixed assets (durable goods) | Buildings, machinery, software, patents | Equity (“in-house” funds) | Share capital, reserves, the year’s net income |
| Current assets (short-term goods) | Inventory, accounts receivable, cash | Liabilities (external funds) | Bank loans, trade payables, tax liabilities |
This simple table highlights the duality of the balance sheet: a company’s possessions are always financed either by its own resources or by external resources. It’s this balance that gives the whole analysis its meaning.
Assets: the company’s tools for creating value
Assets are generally split into two main families, an essential distinction that tells us about the liquidity of the items involved.
- Fixed assets: Think of them as the company’s production arsenal. These are assets designed to stay in place for the long term (more than a year). They include tangible items such as buildings and equipment (tangible fixed assets), but also intangible ones like patents or software. There are also financial fixed assets, such as equity stakes in other companies.
- Current assets: Here we’re talking about everything that moves — everything intended to be sold or converted quickly as part of the operating cycle. Inventory sitting on the shelves, accounts receivable (invoices awaiting payment) and, of course, the cash available in the bank account.
Analyzing assets helps you understand a company’s business model. A factory with machinery worth millions doesn’t have the same risk profile as a consulting firm whose main asset is its order book and its consultants’ expertise.
Liabilities: who finances the business?
Liabilities are the mirror image of assets. They tell us who put money on the table to finance everything we just looked at. They’re crucial for judging a company’s independence and financial soundness.
Reading a balance sheet in France revolves around these two pillars: assets (what I own) and liabilities (what I owe). For many small and medium-sized businesses, using accounting software is no longer a luxury but a necessity to simplify the production and analysis of these documents. These tools ensure reliable bookkeeping and a balance sheet that always balances.
Equity is essentially the “in-house” funds. It includes share capital (the founders’ initial stake), reserves (retained earnings from previous years) and the net income for the year. High equity is often a sign of good health and robustness.
Finally, liabilities represent all the money that doesn’t belong to the company. This includes bank loans, of course, but also amounts owed to suppliers or the government. Knowing how to distinguish long-term liabilities from short-term ones is essential for assessing the immediate financial pressure on cash flow.
If you’d like to dig into the practical aspects of building one, our detailed article on how to prepare a balance sheet will guide you step by step.
How to analyze your company’s assets
Once you’ve grasped the overall structure of the balance sheet, it’s time to dive into the heart of the matter: analyzing the assets. You should see this part as far more than a simple list of what the company owns. It’s actually the true economic engine of your business. This is where you’ll concretely evaluate the tools that help you generate revenue.
Every line of the asset side tells part of your story: the investments you’ve made in the past, your production potential for the future, and even your day-to-day efficiency. That’s why a detailed analysis of assets is an essential step to analyze a balance sheet and truly grasp your company’s performance. If you’re just starting out, our guide on how to read a balance sheet is an excellent starting point.
Evaluating long-term investments in fixed assets
Fixed assets are everything built to last within the company. This includes machinery, buildings, patents, and so on. Analyzing them reveals your investment strategy and your ability to stay competitive.
A high amount of tangible fixed assets can, for example, signal strong barriers to entry in your industry. This is typical in manufacturing. To give you an idea, in 2022 French industrial companies’ balance sheets showed total net assets of approximately 3.15 billion euros. These assets were mostly made up of fixed assets, which shows the weight of the production apparatus. You can check the details on this INSEE data.
To go further, take a look at depreciation. A fleet of machinery that’s almost fully depreciated can mean two things: either you’re excellent at asset management, or you’ll soon need to replace everything, which could weigh heavily on cash flow.
Decoding current assets to assess operational health
Current assets are the heartbeat of your operating cycle. They include inventory, accounts receivable and, of course, cash. This is an excellent thermometer for your company’s short-term financial health.
Rigorous management of current assets is crucial. Rising accounts receivable can look good on paper, but if the cash doesn’t come in, it’s a real risk to your liquidity.
There are two line items I always keep a close eye on:
- Inventory: If your inventory grows faster than your sales, it’s often a bad sign. It can hide overproduction, falling demand or a supply chain that needs revisiting. Either way, it’s cash sitting idle that could be put to much better use elsewhere.
- Accounts receivable: This is simply the money your customers owe you. If this amount balloons, it could mean you’re granting overly long payment terms or, more worryingly, that some customers are struggling to pay you. Tracking the average customer payment period should become second nature.
Let’s take a concrete example: an e-commerce store sees its seasonal product inventory triple right after the holidays. If it doesn’t liquidate them quickly through promotions, these products become dead weight. They lose value and cost money to store. It’s by digging into details like these that balance sheet analysis really becomes meaningful.
Decoding liabilities to assess financial soundness
 After reviewing what the company owns (assets), it’s time to look at liabilities. This part of the balance sheet is just as crucial, because it tells us how the assets are financed. It’s a bit like looking on the other side of the mirror: you discover who the real financial backers are. Are they shareholders, banks, or even suppliers?
Analyzing liabilities is above all about assessing a company’s independence and robustness. As you might expect, a company that relies heavily on its own resources doesn’t have the same risk profile as one financed mainly through debt.
Equity, the company’s foundation
At the very top of the liabilities side, you find equity. This is the company’s true safety cushion, tangible proof of the confidence that founders and investors place in the project over the long term.
This equity includes several key elements:
- Share capital: The initial stake, the money contributed by the shareholders when the company was founded.
- Reserves: Simply the earnings from previous years that weren’t distributed to shareholders but were kept “on hand” to strengthen the company.
- Net income for the year: The profit (or loss, unfortunately) for the year just ended.
A high, and above all growing, amount of equity is an extremely positive signal. It shows that the company is strengthening itself, year after year. For a banker or investor, it’s proof of solidity that carries significant weight. It’s a key point for meaningfully analyzing a balance sheet.
Analyzing liabilities and the debt level
Just below equity, you find liabilities — all the money the company owes to third parties. To see things clearly, it’s essential to distinguish them by repayment horizon.
Long- and medium-term liabilitiesThese are mainly bank or bond loans. They’re repayable over several years and generally used to finance major investments: new machinery, office purchases, and so on.
**Short-term liabilities (or current liabilities)**As the name suggests, these must be repaid quickly, in less than a year. They include:
- Trade payables: The credit your suppliers grant you by allowing you a payment term.
- Tax and social security liabilities: VAT owed to the government, employee social security contributions…
- Bank overdrafts: A convenient solution that can quickly become expensive.
A sound financial structure relies on a delicate balance between these different sources. Incidentally, INSEE’s annual statistics show that most French companies maintain a healthy financial structure. That’s why comparing year N (the year being analyzed) with N-1 (the previous year) is so valuable for tracking this evolution. To go further, you can consult detailed information on the accounting characteristics of companies in France.
The question isn’t whether having debt is a bad thing — it’s often a necessary step to finance growth. The real question is: does the company have the financial strength to repay it without putting itself at risk? This is what’s known as solvency.
To get a clear picture, it’s worth taking a look at the debt ratio (total liabilities / equity). If this ratio is high, it means the company is heavily dependent on its creditors. It’s walking a tightrope and could stumble at the slightest setback.
Let’s take a concrete example. Imagine a startup that just raised funds: its equity is solid. It then takes out a loan to buy equipment. Its structure is healthy. Conversely, a company with low equity and mounting trade payables is a real red flag. It’s financing its daily operations with money it owes in the very short term. That’s an extremely precarious balance.
Making the numbers talk with financial ratios
A balance sheet, taken at face value, is a bit like a snapshot. It’s precise, but static. It shows you what the company owns and owes at a given moment, but it doesn’t really tell its story, its dynamics. To truly understand a company’s health, you need to put these figures into perspective, make them interact with each other. That’s where financial ratios come in.
Think of them as key performance indicators. They turn raw, static data into living, comparable information. By mastering a few essential ratios, you go beyond simply reading an accounting document; you carry out a genuine financial diagnosis. You start spotting strengths, pinpointing weaknesses and glimpsing the company’s potential.
This shift from raw data to strategic analysis is a process in itself.
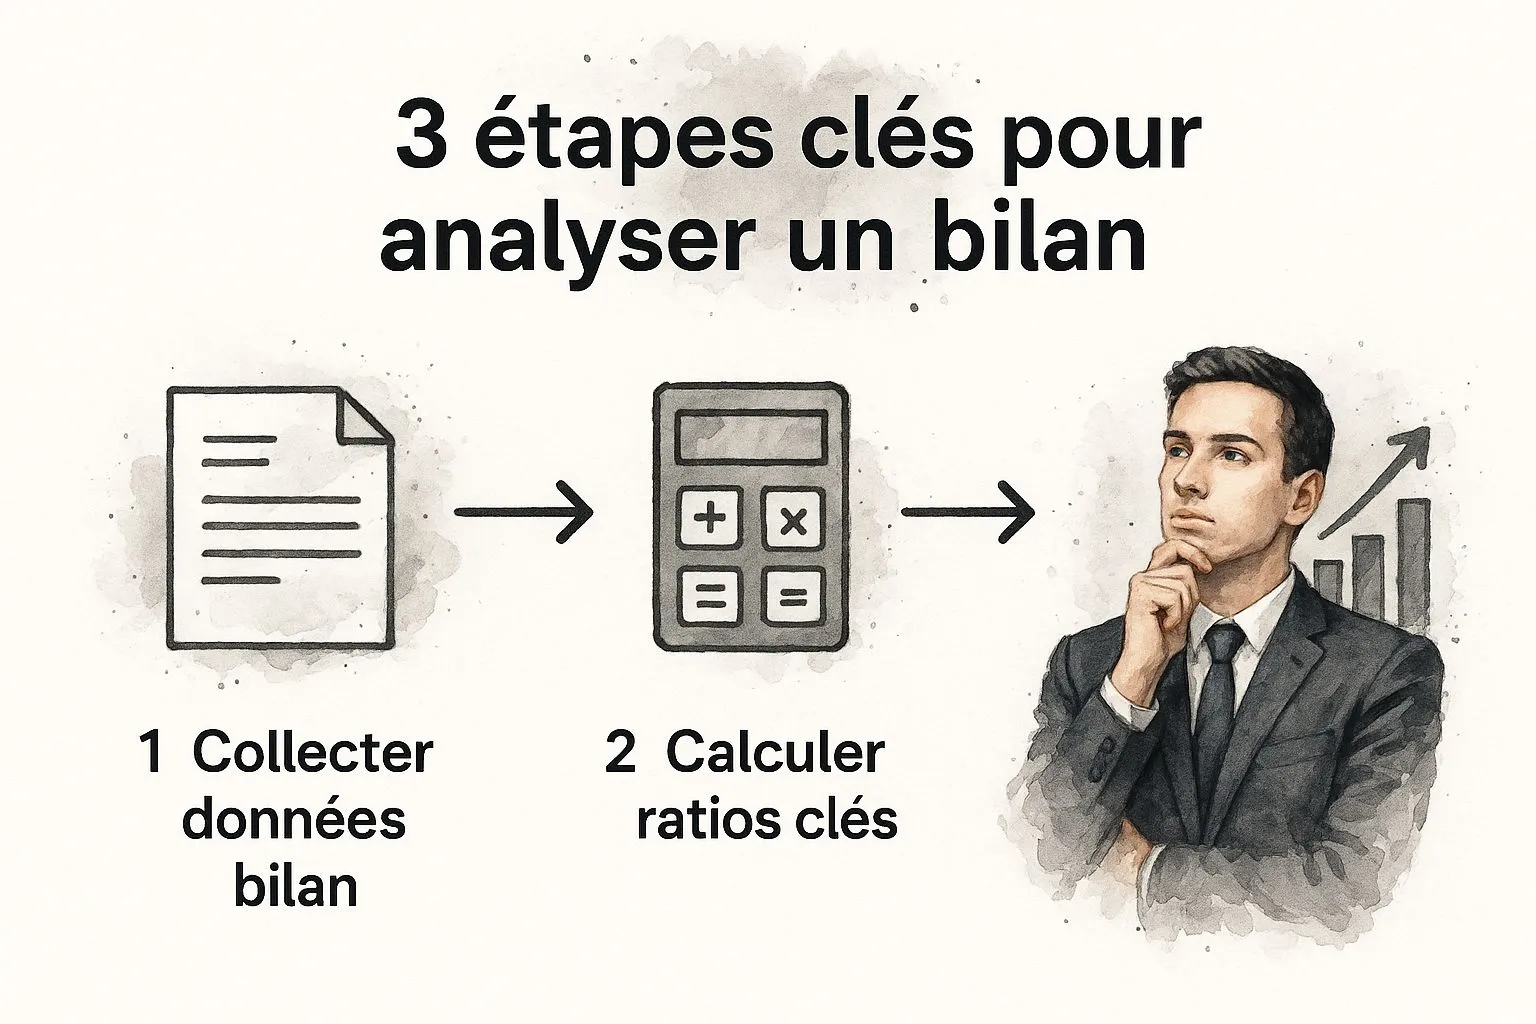
As this diagram clearly shows, calculating ratios isn’t an end in itself. It’s the crucial step that turns simple data collection into an interpretation that’s meaningful for decision-making.
The fundamental trio: working capital, WCR and net cash position
To begin, there are three inseparable indicators that give an overall picture of a company’s financial balance. This is the first level of analysis, and arguably the most important.
-
Net Working Capital (NWC): the safety cushionWorking capital is a bit like the guardian of your long-term stability. It answers a simple question: are your durable investments (machinery, premises, equipment) properly financed by stable resources (your equity and long-term debt)? Positive working capital is reassuring. It means your stable resources not only cover your investments but leave a surplus to help finance part of your day-to-day operations. Negative working capital, on the other hand, is a serious warning sign.
-
Working Capital Requirement (WCR): the pulse of the businessThe WCR is the crux of the matter. It measures the cash-flow gap inherent in your operating cycle. Put simply, it’s the money the company constantly has to “advance” to keep running. It’s calculated as follows: Inventory + Accounts receivable - Trade payables. Imagine paying your suppliers within 30 days but being paid by your customers within 60 days. For 30 days, you have to fund that gap. The WCR quantifies this need. If it spikes, watch out: it can hide poorly controlled growth or late payments from your customers.
-
Net Cash Position (NCP): the final verdictNet cash position is the result of comparing the first two. Its formula is straightforward: NCP = Working capital - WCR. If your safety cushion (working capital) is thick enough to cover the need tied to your business (WCR), your cash position is positive. Congratulations, you’re generating cash. If not, your cash position is negative and you need to find short-term financing, such as a bank overdraft, which is expensive. This is the ultimate indicator of your day-to-day financial health. This analysis is so fundamental that we’ve dedicated a guide to it: calculating your break-even point.
Other essential ratios for a complete diagnosis
Once this first analysis is done, other ratios help refine your judgment on more specific aspects, such as financial dependence or profitability.
To help you see things clearly, here’s a table summarizing the most common ratios that experts, and especially bankers, look at closely.
Essential financial ratios and what they mean
This table compares the key ratios, how they’re calculated, what they measure and how to interpret the results for relevant financial analysis.
| Financial Ratio | Simplified formula | What it measures | Interpretation |
|---|---|---|---|
| Financial Autonomy | Equity / Total Balance Sheet | The share of the company financed by its own resources. | Ideal > 30%. Below that, dependence on debt is considered high, which can make it harder to obtain new loans. |
| Repayment Capacity | Net Financial Debt / EBITDA | The number of years needed to repay debt using the wealth generated. | Ideal < 3 or 4 years. A high ratio is a sign of over-indebtedness in the eyes of banks. |
| Return on Assets (ROA) | Operating Income / Total Assets | How effectively the company uses its assets to generate profit. | Should exceed the average cost of debt. Allows performance comparisons with other companies in the sector. |
| Return on Equity (ROE) | Net Income / Equity | The return on investment for shareholders and partners. | This is the ratio investors watch. A ROE of 15% means that €100 invested generates €15 of net profit. |
Each of these ratios gives you a different perspective. The financial autonomy ratio, for example, is systematically scrutinized by bankers. If your equity represents less than 25-30% of your total balance sheet, they’ll consider you too dependent on creditors, which will make access to credit much harder.
The point isn’t to calculate all of them, but to choose the ones most relevant to your situation and industry.
Putting the numbers into perspective for a meaningful diagnosis

Calculating a handful of ratios is good. But let’s be clear: raw numbers, taken out of context, won’t get you anywhere. To truly analyze a balance sheet and turn it into a decision-making lever, you need to give it depth. A ratio on its own doesn’t say much. Its real value emerges when you compare it.
It’s precisely this contextualization that makes the difference between simply reading the accounts and a financial analysis that’s meaningful for running your business.
Analysis over time: uncovering underlying trends
The first comparison, the simplest yet most revealing, is comparing yourself… to yourself. A balance sheet is a snapshot at a single point in time. But over three, four or five years, this series of snapshots becomes a film that tells the real story of your company.
This dynamic analysis helps answer crucial questions:
- Is our financial structure really getting stronger? You want to see equity growing faster than debt.
- Are we better managing our WCR? Is the financing need tied to the operating cycle under control, even as revenue grows?
- Are our investments paying off? Does the increase in fixed assets translate into better profitability?
Identifying these trends means seeing continuous improvements or, conversely, slow slippage that a single isolated balance sheet could never reveal.
Industry benchmarking: where do you really stand?
Comparing yourself to your own history is essential. But to know if you’re doing well, you need to measure yourself against others. Your working capital requirement may have increased, but if it remains half the industry average, your management is probably excellent.
A good ratio isn’t an absolute value. It’s a ratio that’s better than your competitors’ or better than your industry’s average.
To find this valuable data, turn to professional federations, financial databases (such as Diane or Amadeus), or simply consult the public balance sheets of your competitors. It’s the only way to know whether you’re a leader, on par, or need to make improvements.
The notes to the financial statements: the often-overlooked goldmine
Finally, the last piece of context, and not the least, is hidden in a document many people skim over: the notes to the financial statements. This is a genuine goldmine of qualitative information that gives meaning to the numbers.
The notes can detail the accounting methods chosen, explain major events of the year (an acquisition, a restructuring…) or specify off-balance-sheet commitments.
Taking the time to read the notes gives you the keys to understanding the why behind the numbers. Ignoring them risks completely misreading your analysis.
Frequently asked questions about balance sheet analysis
Even with the best of intentions, diving into financial analysis can quickly feel intimidating. Many practical questions come up. Let’s demystify the most common ones together to turn this analysis into a real lever for your business.
Do you need to be a chartered accountant to analyze your balance sheet?
Absolutely not. Of course, a professional’s expertise is essential for certifying accounts or handling complex tax situations, but every business owner can — and should — understand the major categories of their balance sheet. The idea isn’t to become an accounting technician, but to master the indicators that really matter for running your business.
Knowing your working capital is a bit like knowing what you have in stock. It’s essential day-to-day management information.
How often should you analyze your balance sheet?
An annual analysis, at year-end close, is the bare minimum. It’s an opportunity to take stock (no pun intended) of the past year and set a course for the next one.
But for truly proactive management, you need to go further. I strongly recommend a more regular analysis, for example through quarterly interim statements. This gives you the agility needed to correct course along the way, rather than discovering problems once the year is over.
Don’t think of balance sheet analysis as an annual chore. Think of it instead as a dashboard. You check it regularly to make sure you’re on track and to anticipate upcoming turns.
Can I analyze a competitor’s or partner’s balance sheet?
Yes, and it’s actually a very sound approach! In France, most commercial companies must file their annual accounts with the commercial court registry. This information, including the balance sheet, is therefore public and accessible.
Analyzing a competitor’s balance sheet gives you a valuable benchmark for positioning yourself in your market. Reviewing that of a strategic client or supplier will tell you about its financial soundness. This is crucial information before committing to a long-term relationship. A small habit that can save you from major problems.
Looking to radically simplify how you manage your business and generate your financial reports without pulling your hair out? Bizyness is the solution designed for sole traders and small businesses who want to focus on growth, not paperwork. Discover how Bizyness can automate your accounting today.
