

 Français
Average order value def decoded to boost your sales
Discover our complete guide to average order value. Learn how to calculate it, analyze it and increase it with concrete strategies for your e-commerce business.

The average order value, that indicator everyone talks about! But what exactly is it? Also known by the acronym AOV (for Average Order Value), it simply represents the amount your customers spend on average each time they place an order with you.
It’s a true barometer of your company’s commercial health. Tracking its evolution lets you take the pulse of your business and adjust your strategy to sell more, and better.
Understanding and calculating average order value

To picture the average order value clearly, imagine you run a bakery. Every customer walks out with their small bag of pastries. Some only grab a croissant, others leave with bread, Sunday pastries, and a lunch deal. The average order value is like averaging out all the day’s receipts.
It’s a simple figure, but a remarkably effective one for measuring your customers’ average spending over a given period (day, month, year…).
To help you get a clearer picture, here’s a summary of the key points:
Average order value at a glance
| Key Element | Simple Explanation |
|---|---|
| Definition | The average amount spent by a customer on each purchase. |
| Formula | Total revenue / Total number of orders. |
| Purpose | Measuring commercial performance and identifying growth opportunities. |
| Goal | Increase it to maximize the profitability of each customer. |
This table gives you the basics. Now, let’s move on to practice!
The formula you need to know (and it’s easy!)
No need to pull out a scientific calculator, the calculation couldn’t be simpler. Just divide your total revenue by the number of orders you received over the same period.
Average Order Value (€) = Total revenue (€) / Total number of orders
This formula instantly gives you an accurate idea of what each transaction brings you on average. Be careful not to confuse revenue (total sales) with your profit. If you’re unsure, our guide on how to calculate revenue is here to clarify things.
A concrete example to visualize it
Let’s take a practical case. Imagine a small online shop selling custom t-shirts. In March, it generated €10,000 in revenue by processing 250 orders in total.
The calculation is quick:
- €10,000 in revenue / 250 orders = €40
This shop’s average order value for the month of March therefore comes to €40. This means that, on average, a customer who placed an order that month spent this amount.
Of course, knowing this figure is only the beginning of the journey. What’s most interesting is analyzing it to understand your customers’ buying behavior and, above all, putting actions in place to push it up. That’s where the strategy really begins.
Why average order value is an essential growth lever
Many entrepreneurs see average order value as just a number lost in a report. Big mistake. It’s actually one of the most revealing and powerful indicators for steering the health of your business. Every euro you manage to add to this amount has a direct impact on your margin.
Why give it so much importance? Because it’s often much easier, and above all cheaper, to increase the value of an order than to find a new customer. Think about it: customer acquisition cost (the famous CAC) climbs fast, between advertising, marketing, and time spent. Convincing a customer who’s already about to buy to add a little something to their cart takes far less effort.
A direct impact on your profitability
A close analysis of average order value tells a story. It doesn’t just give you an average, it tells you whether your marketing strategies are effective and whether your product offering is well built. An average order value that’s rising? That’s often a sign that your cross-selling and up-selling techniques are paying off.
Focusing on average order value means maximizing the value of each visitor. A rise of just 10% in this figure can generate more profit than a 20% increase in traffic to your site.
This approach is formidable for optimizing the return on investment of your ad campaigns (ROAS). The logic is simple: if each customer spends more, every euro invested in advertising brings you more.
A compass for your strategic decisions
Tracking the evolution of your average order value is a bit like having a compass to guide your choices. By segmenting it, for example by acquisition channel, you quickly discover which traffic sources bring you the most profitable customers. And therefore, where you should invest your budget.
Concretely, this indicator lets you:
- Validate your marketing actions: Did your “buy 2, get the 3rd free” promo really drive up order value, or just volume?
- Adjust your product catalog: Notice that certain products are often bought together? It’s time to create bundles or grouped offers.
- Optimize the user experience: Offering relevant product recommendations isn’t just a gimmick. It’s a service for the customer, and a revenue lever for you.
In short, working on the definition of average order value and its optimization isn’t just an obsession with numbers. It’s the foundation of a healthy, sustainable growth strategy.
Comparing your average order value to market standards
Knowing that your average order value is €40 is good. But is it a good figure? A strong performance or a warning sign? Honestly, without a point of comparison, this figure doesn’t mean much.
The value of an average order is highly relative. It depends entirely on your industry. It’s only by measuring yourself against your competitors and your market’s standards that you can truly judge your performance. This process is what’s called benchmarking. It’s a crucial step for setting goals that are both realistic and ambitious, based on concrete facts rather than simple intuition.
Why does average order value vary so much from one industry to another?
It’s obvious: the average order value of a luxury site will never be the same as that of an online grocery store. This difference is explained by very real factors that shape how customers buy.
Understanding these dynamics is essential to correctly interpreting your own average order value and adjusting your strategy accordingly.
Several factors explain these gaps:
- The nature of the products themselves: An €800 smartphone doesn’t carry the same weight in a cart as a €20 t-shirt. Logically, expensive products push the average up.
- Purchase frequency: We do our grocery shopping every week, but only buy a computer every three or four years. When purchases are frequent, the average order value is often more modest.
- Seasonality: A toy seller’s average order value will explode as Christmas approaches. For a florist, the peaks will fall more around Valentine’s Day or Mother’s Day.
Examples of average order values by industry
To give you a clearer idea, here are a few benchmarks. Keep in mind these are estimates, but they’re an excellent starting point to position yourself.
Examples of average order values by industry A comparison of average order value ranges observed in different sectors to help you position your business.
| Industry | Average order value range |
|---|---|
| Fashion and accessories | €50 - €120 |
| Consumer electronics | €150 - €400 |
| Cosmetics and beauty | €40 - €90 |
| Home and furnishings | €200 - €600 |
| Everyday consumer goods | €30 - €80 |
Don’t forget the fundamental difference between B2C and B2B either. In business-to-business trade, orders are generally larger and more regular, which translates into a much higher average order value.
So, where do you stand? If your average order value is well below your industry’s average, that’s excellent news: it means your room for growth is huge. If you’re already above it, congratulations! The challenge will be to maintain that lead and find new ways to improve it further.
A few concrete strategies to boost your average order value
Knowing your average order value is good. Increasing it is even better. Fortunately, there are well-known and effective levers to encourage your customers to spend a little more each time they check out. The big advantage? You directly improve your profitability without necessarily needing to attract more traffic.
Far from being pushy sales tactics, these approaches primarily aim to enrich the customer experience by offering more relevant and advantageous deals. Let’s look together at the most effective methods to put in place starting today.
Master the art of cross-selling and up-selling
Cross-selling is simply the art of offering products that perfectly complement what the customer is already buying. Someone adds a smartphone to their cart? Suggest a protective case or wireless earbuds. That’s a classic example of relevant cross-selling.
Up-selling, meanwhile, involves encouraging the customer to choose a slightly more expensive product, but one that offers better quality or extra features. Think of the hotelier offering you an upgrade to a room with a sea view for a small extra fee.
For these offers to be well received, it’s crucial to master certain essential professional communication techniques in order to present them in a convincing, non-intrusive way.
This chart clearly shows how average order value varies across e-commerce sectors.
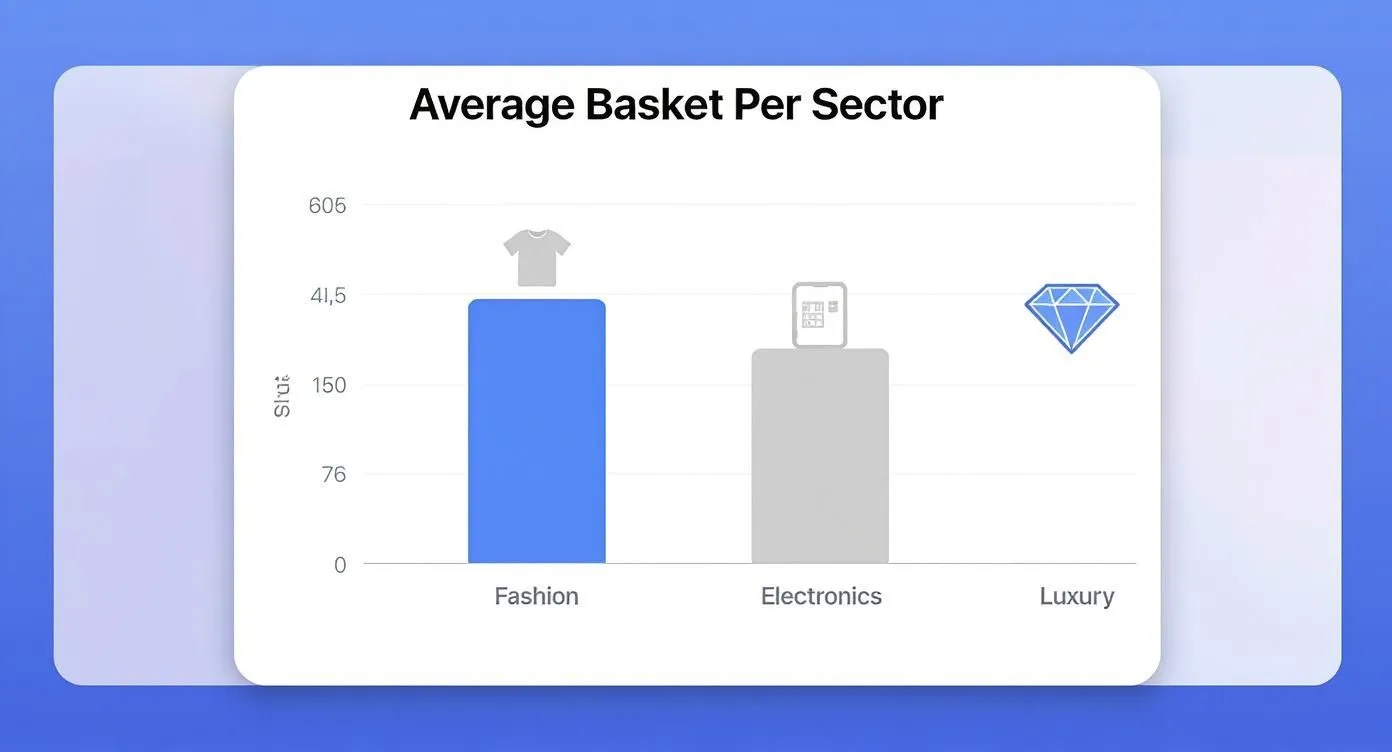
We can immediately see that the luxury sector stands out, highlighting the impact of perceived product value on the final order amount.
Harness the power of bundled offers
Another formidable tactic is bundling, in other words creating bundles. The idea is to group several complementary products into a pack, offered at an overall more attractive price than if each item were bought separately. This increases perceived value and simplifies the purchase decision for the customer.
Bundling works so well because it taps into something very simple: the customer feels they’re getting an excellent deal, while discovering products they might never have bought on their own.
This strategy is a hit in cosmetics (“complete face-care routine pack”) or fine grocery products (“gourmet basket”). It’s also a great way to introduce lesser-known items from your catalog.
Play on psychological levers and incentives
Certain offers have an almost immediate effect on buying behavior and naturally push customers to fill up their cart.
- Offer free shipping above a certain threshold: This is the most widespread technique and arguably one of the most effective. Set a minimum order amount to waive shipping fees, ideally just a bit above your current average order value. Customers will often be tempted to add a little something to avoid paying for shipping.
- Create enticing conditional offers: Promotions like “second item at -50%” or a free gift above a certain purchase amount are powerful triggers. They create a sense of urgency and the feeling of not wanting to miss out on a good deal.
- Launch a loyalty program that rewards spending: By rewarding customers for their purchases, you encourage them not only to come back, but also to spend more to reach the next reward tier.
By intelligently applying these strategies, every order becomes a new growth opportunity. To go even further, don’t hesitate to check out our complete guide on boosting your e-commerce sales.
How to effectively track your average order value
Trying to increase your average order value without measuring it is a bit like sailing the open sea without a compass. To make decisions that matter, it’s essential to set up a reliable, and ideally automated, tracking system. This is what will let you turn raw data into real strategic levers.
The good news is you don’t need to be a data expert to get started. Most of the tools you use daily already have everything you need built in.
E-commerce platforms like Shopify or WooCommerce display this indicator in real time on their dashboards. Google Analytics 4, for its part, goes even further by letting you track your AOV’s evolution and compare it to other key metrics.
Segment your data for a clearer view
The real power of analysis lies in segmentation. Of course, knowing your overall average order value is useful, but it’s by breaking it down that you’ll uncover real gems. Don’t stop at a single number; analyze it from different angles to understand what it’s really telling you.
Here are a few segmentation approaches to explore first:
- By acquisition channel: Do customers coming from social media spend more than those from a Google search?
- By customer type: What’s the difference in average order value between a brand-new customer and a regular?
- By period: How does your average order value evolve during sales, end-of-year holidays, or a product launch?
With this approach, you no longer navigate blindly. You’ll know precisely which marketing campaigns attract the most profitable customers and where to focus your efforts for maximum impact.
Interpret variations to adjust your course
Once your tracking is in place, the most interesting part begins: interpretation. A sudden drop in average order value isn’t necessarily a bad sign if it’s explained by a promotion that attracted a crowd of new customers. Conversely, an increase can sometimes mask a drop in the total number of orders.
Understanding these nuances is essential. Average order value is just one piece of the puzzle. It must be analyzed alongside other commercial performance indicators to get an accurate picture of your business’s health. This ongoing analysis will give you the agility needed to adjust your offers, optimize your campaigns, and drive your growth proactively.
We answer your questions about average order value
The concept of average order value seems simple, but in practice, it often raises a few questions. That’s completely normal! Let’s demystify together the points that can cause confusion, so you can use this indicator with confidence.
Every question is a good opportunity to refine your strategy.
What’s the difference between average order value and customer lifetime value?
I get asked this question often. It’s easy to mix them up, but these two indicators tell completely different stories about your business.
Think of average order value as a simple snapshot. It captures the value of a single order, at a given moment. It’s an excellent tool for measuring the performance of a sale in the short term.
Customer lifetime value (LTV), on the other hand, is more like a movie. It traces the total revenue a customer will bring you over the entire course of their relationship with your brand. LTV is a long-term indicator that judges a customer’s overall profitability.
To put it simply: average order value helps you optimize a sale. LTV helps you optimize the customer relationship. A loyal customer with a small, regular average order value can be far more valuable than a customer who places one large order and never comes back.
Should taxes and shipping costs be included in the calculation?
The golden rule here is consistency. Choose a method and stick to it so your analyses stay reliable over time. That said, the most common practice, and the one I recommend, is to exclude VAT and shipping costs from the calculation.
Why? Simply because these amounts don’t correspond to the value of the products the customer chose to buy. If you include shipping costs, for example, you risk skewing your figures, especially if you’re testing free-shipping thresholds. Average order value should reflect what customers spend on your products, full stop.
How often should you analyze average order value?
There’s no universal answer, since it all depends on your industry and sales volume. Here are a few pointers to guide you anyway:
- For a high-traffic e-commerce business: A weekly check is a good idea. It lets you react quickly to trends and adjust your marketing campaigns almost in real time.
- For a small business or a physical store: A monthly review is generally perfect. It’s frequent enough to see major trends emerge, without getting lost in day-to-day fluctuations.
- For absolutely everyone: A quarterly and annual analysis is essential. This is the moment to step back, see whether your long-term strategies are working, and compare your performance year over year.
The most important thing is to establish a routine. Make average order value analysis a reflex, and you’ll never navigate blindly again.
For accurate, effortless tracking of your average order value and all your financial indicators, Bizyness centralizes your sales data. It provides you with clear dashboards so you can make the best decisions, quickly. Discover how to simplify your management at bizyness.fr.
