

 Français
Creating and reading a balance sheet table
Learn how to build and interpret a balance sheet table. A practical guide to understanding your company's financial health without the jargon.

The balance sheet table is far more than a simple formality. It’s the most faithful snapshot of your company’s financial health at a given moment. Think of it as an annual health check-up: it shows you what your company actually owns (its assets) and what it owes (its liabilities). The goal is simple: to give you a clear, structured view of your net worth so you can steer your business, reassure your partners and, above all, make the right decisions.
The balance sheet decoded for entrepreneurs

For any business owner, mastering how to read a balance sheet is an essential skill. It’s often seen as a complex document, best left to the accountant, but that’s a mistake. It’s your real dashboard. It tells a story: how you finance your resources and how you use them to create value.
The basic principle is a perfect balance, a logic that traces back to double-entry bookkeeping, formalized as early as the 16th century. The modern balance sheet is the direct descendant of this historical method, which ensures every transaction has its counterpart. For the curious, the detailed history of accounting on l-expert-comptable.com (French) is fascinating.
The two pillars of the balance sheet
Your balance sheet always presents itself as two large columns that must, at all costs, be equal. Think of a set of scales: on one side, what you own (assets), and on the other, where the money comes from (liabilities).
To make things clearer, here’s a simplified structure that illustrates this principle well.
Simplified structure of a balance sheet
This table shows the two main columns of a balance sheet (Assets and Liabilities) with concrete examples for each category to illustrate their role.
| Category (Assets) | Concrete examples | Category (Liabilities) | Concrete examples |
|---|---|---|---|
| Fixed assets | Buildings, machinery, software, vehicles | Equity | Share capital, personal contribution, reserves, net income for the year |
| Inventory | Raw materials, goods for sale | Financial liabilities | Bank loans, leases |
| Trade receivables | Invoices sent but not yet paid | Trade payables | Invoices received but not yet settled |
| Cash | Money in the bank account, cash on hand | Social and tax liabilities | Social contributions payable, VAT to be remitted |
This equality between assets and liabilities isn’t magic. It’s the very foundation of accounting logic: every euro of resource on the liabilities side is used to finance one euro of property or right on the assets side.
Why is the balance sheet so important?
Beyond its mandatory nature, the balance sheet is above all a formidable strategic tool. It’s the document you’ll present to your banker to prove your company’s soundness and secure financing. They will scrutinize it to gauge your repayment capacity.
For an entrepreneur, knowing how to read your balance sheet is like a ship’s captain knowing how to read a nautical chart. It’s what lets you sail safely, anticipate financial storms and stay on course toward growth.
Internally, the balance sheet table is your best ally for making decisions. Should you invest in new machinery? Is it wise to hire a new employee? The answer often lies in analyzing the structure of your balance sheet. It’s truly the cornerstone of your management, the foundation on which you build a sustainable, profitable business.
Building your balance sheet without errors
Drawing up a reliable balance sheet table is far less intimidating than it seems. The idea isn’t to turn yourself into an accountant overnight, but to grasp the logic behind it well enough to gather the right information and file it in the right place. Your best ally in this exercise? Rigor. It’s what will guarantee a faithful picture of your company’s net worth.
The very first step is always gathering the supporting documents. Equipment purchase invoices, bank statements, depreciation schedules, loan agreements, unpaid customer invoices, supplier debts… everything needs to go through. This collection phase is absolutely crucial; a single oversight can be enough to throw off the whole balance sheet.
Once you have all this data in hand, the real work begins: classification. This is where the magic happens, by clearly distinguishing what your company owns (Assets) from what it owes (Liabilities). This organization is what will make your figures readable and, above all, usable.
To make things clearer, here’s an overview of the process.
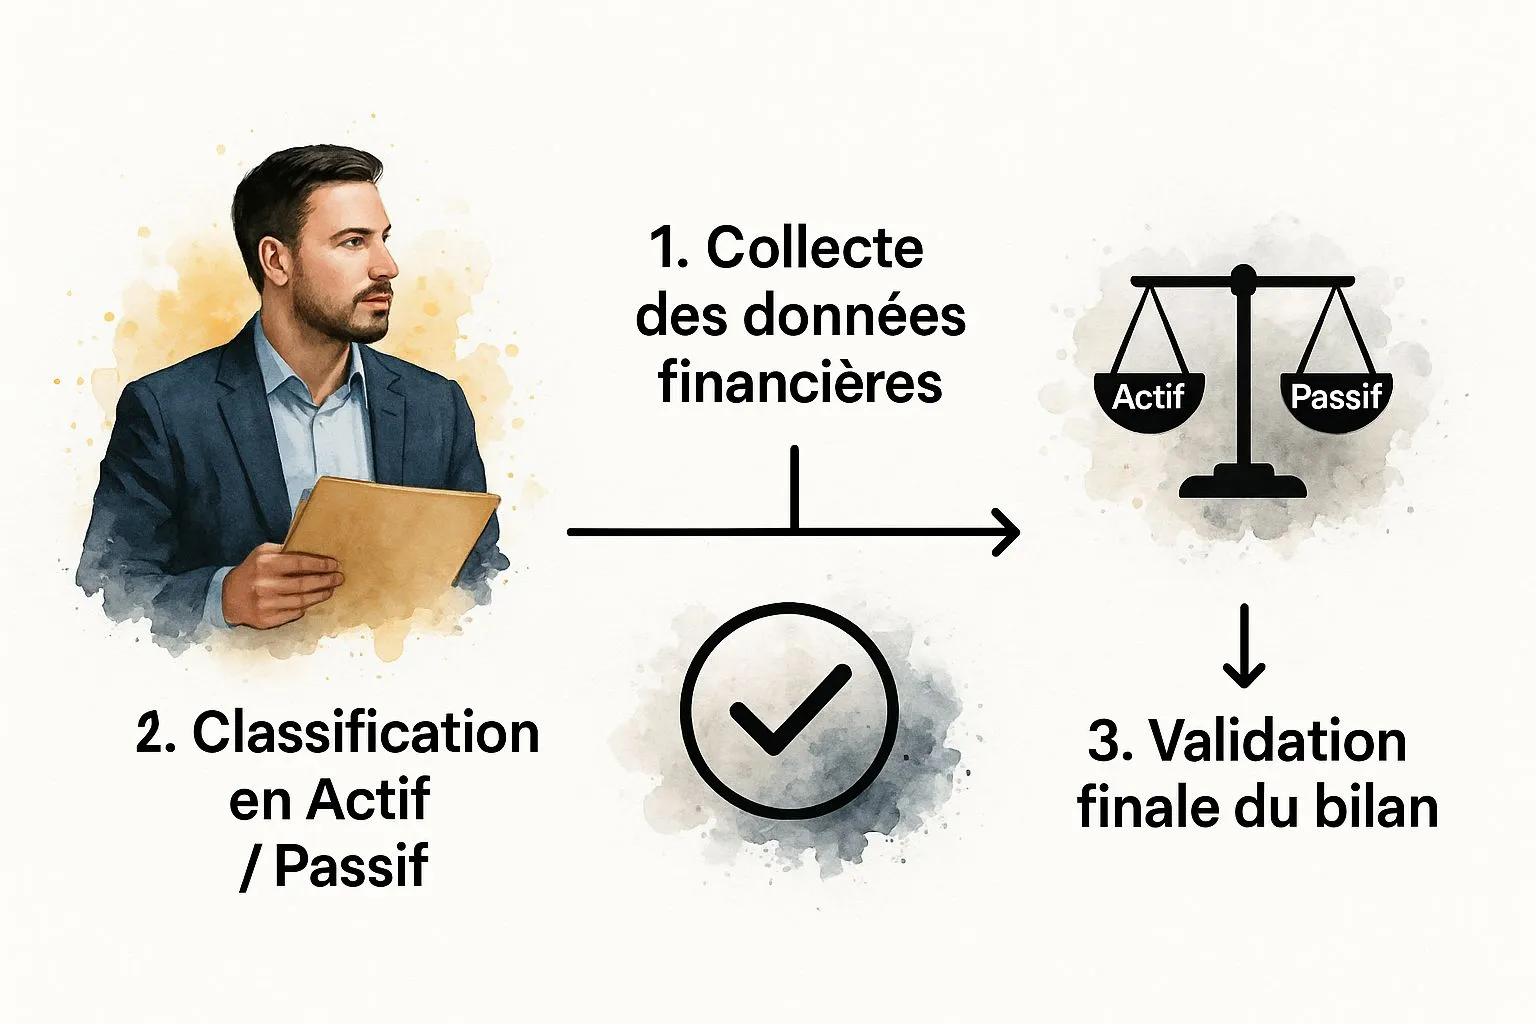
Ultimately, it’s a logical sequence: gather, sort, then verify. The soundness of each step relies on the quality of the previous one, which shows just how fundamental thorough data collection is from the outset.
Breaking down your company’s assets
Assets are made up of two large families. It’s essential to distinguish them clearly for your analysis to hold up.
-
Fixed assets: Here we’re talking about everything your company holds over the long term (more than a year) and won’t sell any time soon. Think of your computers, machinery, company vehicle, but also less tangible items like software or a patent. For each asset, you start from its purchase value and subtract accumulated depreciation.
-
Current assets: This group covers shorter-term items, those destined to turn into cash fairly quickly. It mainly includes inventory of goods, trade receivables (money your customers owe you) and, of course, your available cash in the bank or till.
A mistake I often see is a poor valuation of inventory. An overly optimistic view can artificially inflate the value of assets, while undervaluation will understate it. My advice: adopt a consistent valuation method (such as weighted average cost or FIFO) and stick to it.
A balance sheet is like a puzzle where every piece has its place. Forgetting a trade receivable leaves a gaping hole in the middle of the picture. The overall image becomes misleading and your future cash flow is poorly anticipated.
Organizing liabilities with method
Liabilities, for their part, tell us how the assets are financed. This side too is divided into several categories that need to be ordered carefully.
We start with equity. It represents the stable, lasting resources of the company: the share capital that you and your partners contributed at start-up, profits from past years that were set aside as reserves, and of course the result (profit or loss) for the current period. Solid equity is an excellent trust signal for your partners.
Next come the liabilities. It’s crucial to classify them by order of maturity.
- Financial liabilities: These are mainly medium- or long-term bank loans.
- Operating liabilities: These are short-term. This includes your suppliers’ invoices, salaries payable, or tax and social liabilities (VAT to be remitted, URSSAF contributions).
Building this document requires great precision. To be sure you don’t make any mistakes and to guarantee its reliability, it’s often very wise to call on a qualified accountant (French resource). Even when using a powerful tool like Bizyness, a professional’s eye can validate your choices and help you optimize your situation. If you’d like to go further into the method, feel free to read our article that explains in detail how to prepare a balance sheet.
What your assets reveal about your business

A well put-together balance sheet table is far more than a simple legal obligation. It’s a genuine goldmine. While mathematical balance is the foundation, it’s mainly by scrutinizing the “Assets” column that you’ll uncover the secrets of your company’s performance and strategy.
This part of the balance sheet doesn’t just list what you own. It tells a story: how you invest and manage your resources to create value.
This approach to analyzing net worth isn’t new. In France, the idea of mapping a nation’s wealth goes back to the 18th century with a certain François Quesnay. In the early 19th century, economists like Lesur and Chaptal pushed the concept further with genuine numbered economic balance sheets.
It’s exactly this logic that we apply today to your company by looking at three key asset items.
Interpreting your fixed assets
Fixed assets are your long-term investments: equipment, premises, patents or software. If this item grows, it’s often a sign of a growth strategy. You’re buying new machinery to boost production, or better software to gain efficiency.
Conversely, if your fixed assets stagnate year after year, be wary. This could reveal underinvestment which, over time, risks costing you dearly in competitiveness. Also keep an eye on depreciation, which reflects the wear on these assets and their loss of value over time.
The hidden message in your inventory
For a company that sells or produces goods, the inventory line is an ultra-sensitive barometer of its commercial health. It’s a point never to overlook.
- Inventory swelling? That might be a warning sign. Often it means sales are sluggish or your forecasts were a bit too optimistic. Excessive inventory ties up your cash and generates costs (storage, insurance…).
- Inventory shrinking fast? That can be excellent news, a sign of strong demand. But watch out, it can also signal a risk of stockouts. And a stockout means a lost sale and a potentially frustrated customer.
A good habit is to calculate your inventory turnover rate. The higher it is, the better: your products aren’t gathering dust on the shelves.
Trade receivables, a direct indicator of your cash position
Trade receivables are simply the money your customers owe you. This is a line to watch like a hawk. If the amount of receivables suddenly spikes, it can indicate that your customers are struggling to pay or that you’re granting payment terms that are too long.
A balance sheet is above all a dialogue between what you own (assets) and what you owe (liabilities). If your trade receivables balloon without your cash following suit, that’s the classic symptom of tensions to come. Selling is good, but if you’re not collecting, you’ll quickly struggle to pay your own bills.
Analyzing assets depends heavily on your sector. A service agency will have very little in fixed assets and inventory, but potentially significant trade receivables. An e-commerce business, on the other hand, will see its inventory as a major asset. Knowing how to decode these nuances is key. To go further, we’ve prepared a complete guide to teach you how to read a balance sheet and get the most out of it.
Now that we’ve combed through assets, it’s time to turn to the other side of the coin: the liabilities of your balance sheet table. This part is just as crucial, because it tells a story: how your company finances everything it owns. It’s, in a way, the identity card of your financial structure.
Liabilities aren’t just a simple list of debts, far from it. They reflect the trust that your various partners — whether shareholders, bankers or suppliers — place in your project. By analyzing their composition, you get a clear picture of the soundness and sustainability of your business model.
Equity: the foundation of your stability
At the very top of liabilities, we find equity. It represents the money the shareholders put on the table (the famous share capital) as well as profits that weren’t distributed but reinvested in the company over time (reserves). Think of it as the foundations of your house: the sturdier they are, the more stable the whole structure.
Having high equity is an excellent signal. It proves the company is able to partly self-finance and has a safety cushion to absorb hard knocks without wobbling. For a banker studying a loan application, it’s a major sign of confidence.
Well-structured liabilities are the guarantee of sound financing. Robust equity acts as a safety cushion, while controlled debt becomes a lever for growth, not a burden.
Conversely, low or even negative equity should immediately raise a red flag. It’s a genuine warning sign indicating that the company is very dependent on its creditors and thus particularly vulnerable to the slightest downturn.
Debt: a double-edged tool
Just below equity, we find liabilities. It’s essential not to demonize them. After all, a company with no debt at all is often a company that doesn’t dare invest to grow. The key is knowing how to distinguish “good” debt from “bad” debt.
- Good debt: This is debt taken on to finance an investment that will bring in more than it costs. Buying new machinery to increase production is a perfect example. It creates value and is designed to be repaid from the future profits it generates.
- Bad debt: This is debt used to repeatedly plug cash-flow gaps. It finances no productive asset and heavily drags down your liquidity, dragging you into a vicious circle.
But the analysis doesn’t stop there. You also need to look at the maturity of this debt. If it’s mostly long-term and finances durable assets (such as a building or equipment), that’s generally a sign of good management. On the other hand, if you’re financing your premises with short-term credit, you’re heading straight for financial disaster.
Debt management is such an important issue that it even applies at the scale of a country. To illustrate how financial charges can weigh things down, the French state’s balance sheet is very telling. If the topic interests you, you can consult the 2022 report on French government accounts, which details this dynamic well.
To quickly take stock of your own situation, there’s a key indicator: the debt ratio, calculated by dividing total liabilities by equity. As a general rule, a ratio below 1 is considered healthy, as it shows the company is mainly financed by its own funds. Beyond that, the level of risk increases. It’s a simple but remarkably effective tool for assessing your financial independence.
Turn your balance sheet into a genuine management tool
Don’t make the mistake of treating your balance sheet table as a simple document to file away once the fiscal year closes. It’s much more than that. Its true potential is revealed when it becomes an active management instrument, a compass to guide your strategic decisions. You need to go beyond simply reading the numbers to turn this document into a genuine growth lever.
This dynamic analysis is crucial. A Bpifrance study reveals that 32% of companies report facing difficult cash flow. Knowing how to use your balance sheet to anticipate these tensions is therefore a key skill for any business owner. To get there, you need to make the numbers speak by calculating a few essential financial indicators.
Financial ratios to watch closely
For your balance sheet to become an effective dashboard, you need to focus on three fundamental indicators. These are what will give you a clear view of the financial health of your operating cycle.
-
Net Working Capital (NWC): It measures the portion of your stable resources (your equity and long-term liabilities) that finances your current assets. Positive net working capital is an excellent sign. In concrete terms, it means you have a surplus of durable resources to cover your short-term needs.
-
Working Capital Requirement (WCR): This represents the cash-flow gap your business generates on a day-to-day basis. It’s the money you need to advance to finance your inventory and trade receivables while waiting to be paid. Watch out, a rising WCR can quickly put pressure on your liquidity.
-
Net Cash Position: This is the result of the calculation NWC minus WCR. If your net cash position is positive, congratulations! Your company is generating a surplus of liquidity. If it’s negative, you’ll need to find short-term financing, such as a bank overdraft, to close the gap.
A deteriorating WCR is often the very first warning sign of an approaching cash-flow crisis. By monitoring its evolution closely, you can act before it’s too late, for example by renegotiating your payment terms.
Concrete actions to optimize your balance sheet
Once you have these figures in hand, you can move to action. Is your WCR rising dangerously? It’s time to work on reducing your customers’ payment terms or negotiating longer terms with your suppliers. Is your net working capital a bit weak? Consider strengthening your equity or converting your short-term debt into a longer-term loan.
To go further and master all the subtleties of this tool, you can discover other approaches to analyzing your balance sheet and extract even more valuable information from it. By building these ratios into your management habits, you’ll turn your balance sheet table into a powerful ally for your growth.
Your frequently asked questions about the balance sheet
When you start creating a balance sheet table, you quickly find yourself with a host of very concrete questions. That’s completely normal. As a business owner, you need clear answers to make this essential tool your own. So I’ve gathered the most frequent questions here to help clarify things.
Is the balance sheet really mandatory for everyone?
This is often the first question that comes to mind. The answer is no, not systematically. It all depends on your legal status and tax regime.
Let’s take a concrete example: an SCI (French real-estate holding company) under income tax has, in theory, no legal obligation to produce a balance sheet. But watch out, if that same SCI opts for corporate tax, then the balance sheet becomes an unavoidable annual formality.
Do you absolutely have to go through an accountant?
The law doesn’t require it in every case. That said, I strongly recommend it, especially if your business is starting to grow. Calling on a professional ensures everything is in order and helps you avoid mistakes that, in the end, can be very costly. It’s a safeguard that’s priceless.
At what time of year should you prepare your balance sheet?
The balance sheet is prepared at the end of each fiscal year, which almost always spans 12 months. The most common closing date is December 31, but that’s not an absolute rule.
For a business owner, understanding your balance sheet isn’t just about meeting an obligation. Above all, it’s about giving yourself the means to assess your company’s real solvency and anticipate future financing needs.
This clear vision is essential for effectively steering your business.
What’s the difference between a balance sheet and a financial statement of position?
I get asked this question often. Although they use the same figures, their purpose differs. It’s a matter of presentation and analysis.
- The balance sheet is the “official” version, with a standardized structure dictated by the general chart of accounts.
- The financial statement of position, on the other hand, reorganizes this data to highlight liquidity and maturity. It ranks assets from the most liquid (what can be turned into cash quickly) to the least liquid, and liabilities from short-term debt to stable resources.
Bankers love the financial statement of position, as it gives them a direct read on your ability to repay your debts. It’s a very pragmatic point of view.
How can I look up another company’s balance sheet?
That’s an excellent question, whether it’s to analyze a competitor or a potential partner. For commercial companies (such as French SARLs or SASs), the annual accounts, including the balance sheet, are public documents. You can easily find them on official platforms like Infogreffe or other specialized online services.
Simplify the creation of your balance sheet table and focus on what really matters: growing your business. With Bizyness, automate your financial management effortlessly and ensure your compliance in just a few clicks. Discover the solution designed for entrepreneurs like you at bizyness.fr.
