

 Français
Break-even point definition, simplified for online sellers
The guide to mastering your break-even point. Learn how to calculate it, interpret it, and optimize it with examples for Shopify, Amazon, and SaaS.

In concrete terms, the break-even point is simply the amount of revenue you need to reach for your sales to cover all of your expenses. It’s your financial balance point. Below it, you’re losing money. Above it, every new sale starts generating profit.
What is the break-even point for an e-commerce business
Think of your online store as a boat. For it to even float and hold its course, it needs a minimum amount of fuel to run its engines (your fixed and variable costs). The break-even point is the exact moment when you’ve put in just enough fuel to avoid sinking. You’re not yet moving toward profitable waters, but you’re no longer going under.
This number is the true financial GPS of any entrepreneur. Whether you’re on Shopify, selling through a marketplace like Amazon, or even offering software, this indicator is your best ally. It’s not some obscure concept reserved for accountants; it’s a day-to-day steering tool.
The break-even point turns anxiety into a measurable objective. It finally answers the question: “How much do I need to sell, at minimum, for my project to be viable?”
Why this indicator is vital for you
Mastering your break-even point gives you a level of control that few entrepreneurs take the time to acquire. Very concretely, it lets you:
- Set your prices without second-guessing: No more finger-in-the-air guessing. You know exactly at what selling price a product becomes profitable and starts paying your bills.
- Steer your advertising budgets: You can finally calculate the maximum customer acquisition cost (CAC) you shouldn’t exceed so that every euro spent on ads actually pays off.
- Manage your cash flow with peace of mind: By calculating the “break-even day” (the moment you’ll reach this threshold), you anticipate your cash needs much better and avoid cold sweats.
- Make better strategic decisions: Should you hire? Change warehouses? Launch a product? This indicator helps you quantify the impact of each decision on your path to profitability.
In short, knowing and tracking this indicator demystifies your business’s performance. It makes it tangible. By mastering the break-even point definition, you no longer navigate blindly, but with a clear roadmap toward profitability.
To calculate your break-even point, it’s not enough to plug numbers into a formula. You first need to understand the three main pillars of your financial structure: fixed costs, variable costs, and the margin you generate.
This is a crucial step. If you misclassify your expenses, the entire calculation will be off, and so will your decisions. Let’s see how to make the distinction correctly.
Fixed costs: what your business costs you, even without selling
Fixed costs, or structural charges, are all the expenses you have to cover no matter what. Whether you make one sale or a thousand this month, these amounts won’t move. They represent the financial foundation of your business.
For an online seller, it’s fairly easy to picture:
- Your platform subscription, such as Shopify or another solution.
- Your team’s salaries (if you have any) and the associated payroll taxes.
- The rent for your warehouse, office, or storage space.
- Subscriptions to your essential software, such as a financial management tool like Bizyness.
Think of it as your business’s “rent.” It’s the baseline you need to cover every month, just to keep the doors open.
Variable costs: the heartbeat of your sales
By contrast, variable costs are directly tied to each sale you make. No sale? Zero variable cost. Sales take off? They increase proportionally.
These costs represent everything you spend to get a specific order safely to your customer.
To figure out whether an expense is variable, ask yourself this simple question: “If I hadn’t made this particular sale, would I still have had to pay this cost?” If the answer is no, it’s a variable cost.
In e-commerce, the examples are numerous and concrete:
- The purchase cost of your product from the supplier.
- The transaction fees you pay to Stripe or PayPal.
- The commissions taken by marketplaces like Amazon or Etsy.
- Packaging costs (box, padding) and shipping for each parcel.
This simple table can help you see things more clearly and classify your own expenses.
Examples of fixed and variable costs for an online seller
This table helps you classify your expenses to distinguish fixed costs (independent of sales) from variable costs (tied to each sale).
| Cost type | Concrete e-commerce examples | How Bizyness helps you track them |
|---|---|---|
| Fixed costs | Shopify/Wix/other subscription, salaries, warehouse rent, software subscriptions (emailing, CRM…), insurance. | Bizyness syncs with your bank to automatically categorize these recurring charges and integrate them into your reports. |
| Variable costs | Cost of goods sold (COGS), transaction fees (Stripe, PayPal), shipping fees, packaging, marketplace commissions. | By connecting your accounts (Shopify, Stripe, etc.), Bizyness isolates these costs for each sale, giving you a precise view of your margin. |
Clearly distinguishing between these two types of costs is fundamental. To go further on this topic, our guide on the difference between direct and indirect costs will help you refine your analysis.
Contribution margin: what you’re really earning on each sale
Now that your costs are clearly identified, we can calculate what really matters: the contribution margin. This is the money left in your pocket after a sale, once variable costs are deducted.
The formula is simple: Selling Price (excl. VAT) - Variable Costs (excl. VAT).
But for your break-even point, it’s the rate that changes everything. The contribution margin ratio is the real key. It’s calculated as follows: (Contribution Margin / Revenue) x 100.
This percentage tells you what share of every euro collected is actually available to pay your fixed costs and, ultimately, start generating profit. The higher this rate, the more solid your business model.
Nothing beats getting your hands dirty to really grasp a concept like the break-even point. Let’s set aside pure theory for a moment and dive into some real numbers. To make everything perfectly clear, we’re going to break down two practical cases, two scenarios every online seller knows well.
In the first, we’ll follow a creator who sells directly on her own Shopify store. The second will take us behind the scenes of a seller on the Amazon marketplace, who relies on the FBA (Fulfillment by Amazon) service. You’ll see, the cost structure and challenges are not at all the same.
Before we start, picture this path: every sale you make must first pay back its own costs before it can help pay the rent and the salaries. That’s the journey we’re trying to understand.
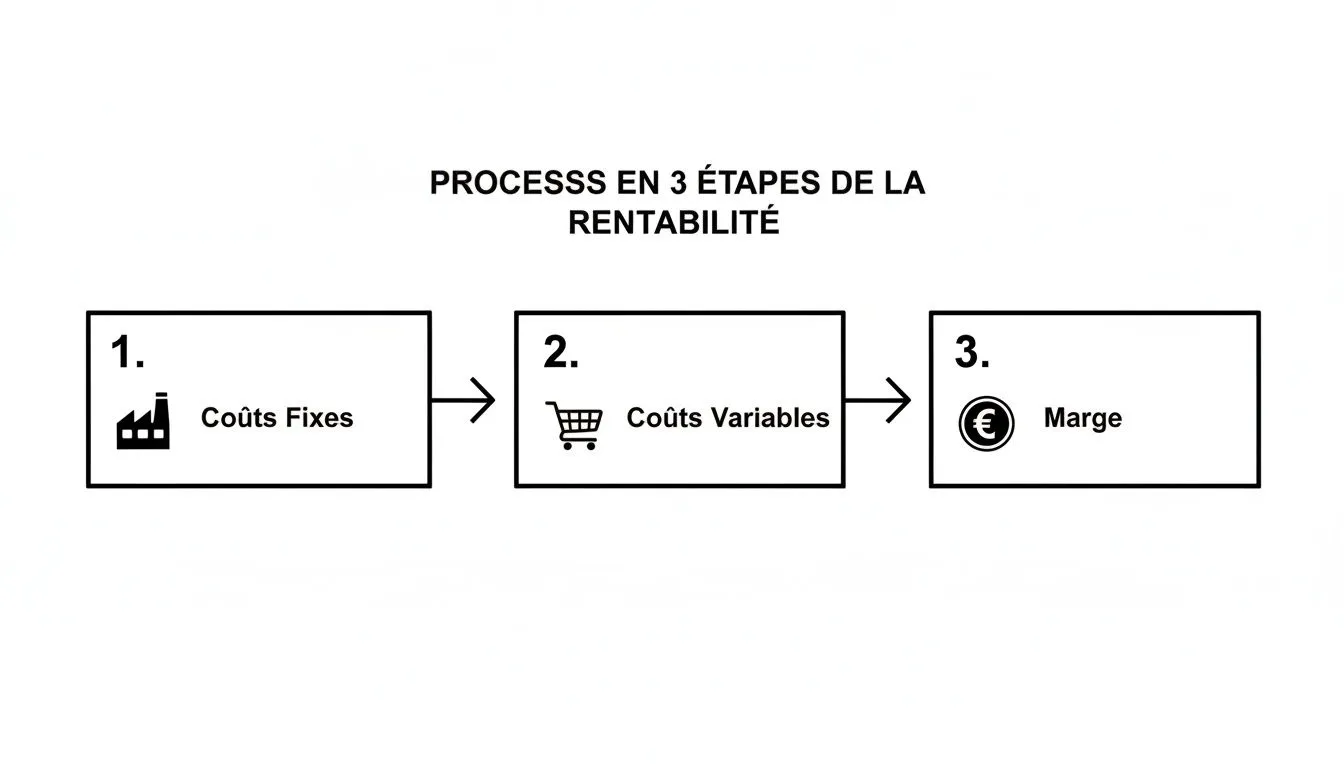
The principle is simple: your revenue first pays the variable costs, and it’s the remaining margin that goes toward covering the fixed charges. Once the fixed charges are covered, every additional euro becomes profit.
Case 1: selling on your own Shopify store
Imagine a costume jewelry brand that chose independence with its own Shopify store. It manages its stock in a small workshop and packs its own parcels.
Here’s what its finances look like, in simplified form:
- Monthly fixed costs: €3,000. This covers the Shopify subscription, the workshop rent, part of her salary, and her software tools, like Bizyness.
- Average selling price per item: €80 excl. VAT.
- Variable costs per item: €32 excl. VAT. This includes the cost of raw materials, packaging, Stripe transaction fees, and the average shipping cost.
The first, absolutely essential step: calculate the margin she generates on each sale. This is the fuel for her business.
- Contribution margin = Selling price - Variable costs = €80 - €32 = €48
- Contribution margin ratio = (Margin / Selling price) * 100 = (€48 / €80) * 100 = 60%
This 60% is a golden number. It means that on a €100 sale, once direct costs are paid, she has €60 left to pay her €3,000 in fixed charges.
With this rate, calculating the break-even point becomes child’s play:
Break-Even Point (in revenue) = Fixed Costs / Contribution Margin Ratio
€3,000 / 0.60 = €5,000
In concrete terms, her store needs to generate €5,000 in revenue every month just to break even. In terms of number of products, that works out to €5,000 / €80, or roughly 63 pieces of jewelry to sell before she starts making money.
Case 2: selling via Amazon FBA
Let’s change the scenery. Take a sporting goods accessories seller who chose the power of Amazon and its FBA program. Amazon stores, prepares, and ships the products for them. A convenience that comes at a cost.
Their expense structure is radically different:
- Monthly fixed costs: €1,500. Their fixed charges are lower: a few basic storage fees at Amazon, their software, and a small advertising budget outside the platform.
- Average selling price per item: €50 excl. VAT.
- Variable costs per item: €30 excl. VAT. Here, the devil is in the details: product purchase cost, 15% Amazon commission, FBA shipping fees, and advertising budget directly on Amazon.
Let’s calculate their margin, which is likely to be quite different from our jewelry creator’s:
- Contribution margin = €50 - €30 = €20
- Contribution margin ratio = (€20 / €50) * 100 = 40%
You can immediately see the impact of the marketplace’s commissions. The margin is much lower. Let’s see what that means for the break-even point:
Break-Even Point (in revenue) = €1,500 / 0.40 = €3,750
This example is telling: even with much lower fixed costs, the tighter margin forces this seller to generate a substantial sales volume of €3,750 to reach break-even. It’s the classic marketplace trade-off: lower fixed charges, but lower per-unit profitability.
These two examples give you a solid foundation. To dig deeper and adapt the calculations to your own situation, you can check out our complete guide to calculating your break-even point. Once you’ve mastered this indicator, the next logical step is learning how to calculate return on investment (ROI) to make sure every euro spent on marketing is working effectively for you.
Beyond the number: turning your break-even point into a real GPS for your business
There you go, you’ve calculated your break-even point. You have that number, let’s say €75,000. That’s an excellent first step, but as it stands, it’s just a number on a page. The mistake would be to stop there.
For it to become a real steering tool, you need to bring it to life. The real question isn’t just how much you need to sell, but also when you’ll become profitable and what your margin for error is. That’s where the true value of this indicator is revealed.
The break-even day: your profitability marked on the calendar
The break-even day is the first concrete translation of your break-even point. Forget euros for a moment, we’re now talking in days. The break-even day is simply the date in the year from which your business finally starts generating profit.
Before that date, every euro collected goes toward paying the bills (rent, salaries, subscriptions, etc.). After it, every euro of margin contributes directly to your profit.
The calculation to find this date is child’s play:
Break-Even Day (in days) = (Break-Even Point / Projected Annual Revenue) x 365
Imagine a SaaS software publisher selling via Paddle in France. Their fixed charges amount to €30,000, their break-even point is €75,000, and they’re targeting €300,000 in revenue this year.
The calculation is therefore: (€75,000 / €300,000) x 365 = 91.25 days.
In plain terms, this entrepreneur knows they’ll be working for roughly 92 days, or until early April, just to cover their costs. It’s only from day 93 onward that they can start telling themselves: “That’s it, now I’m making money.”
The margin of safety: your protective cushion
The margin of safety is the second essential indicator to derive. Think of it as your financial “cushion.” It measures how much your revenue can drop before your business slips into the red.
It’s your room for error, your resilience gauge in the face of a slowing market or a disappointing marketing campaign.
Here’s how it’s measured:
- Margin of safety (in €) = Projected revenue - Break-even point
- Safety margin ratio (in %) = (Margin of safety / Projected revenue) x 100
Using our figures, the margin of safety is €300,000 - €75,000 = €225,000. The safety margin ratio, meanwhile, is (€225,000 / €300,000) x 100 = 75%.
This ratio of 75% is extremely telling: the business can afford to see its revenue drop by three-quarters before starting to lose money. Such a figure speaks to a very solid business model. Yet it’s estimated that nearly 42% of online sellers ignore or underestimate the importance of this calculation, as detailed in this excellent break-even point guide.
For those selling internationally on WooCommerce, the complexity increases with tax thresholds like the OSS threshold of €10,000 for EU sales. Failing to track them can quickly turn your margin into penalties. This is precisely why tools like Bizyness exist: they monitor these thresholds automatically and let you focus on growth with peace of mind.
Three levers to reach profitability faster
Knowing your break-even point is good. But as an entrepreneur, your real goal is to exceed it, and as fast as possible. After all, every day spent below this threshold is a day your business is losing money.
The good news is you hold the cards. The formula itself shows the way: to lower this threshold, all you need to do is act on one of the three components that make it up. Think of them as three levers you can adjust to speed up your trajectory toward profit.
Lever 1: Lighten your fixed costs
Picture your fixed costs as an anchor weighing on your business every month, whether you make sales or not. Lightening this load has an immediate effect on your break-even point. Every euro of fixed cost you save is one less euro you need to cover with your sales.
For an online seller, there’s no shortage of options:
- Clean up your subscriptions: Go through your Shopify apps and other SaaS tools with a fine-tooth comb. Are you really using all the features you’re paying for? It’s not uncommon to find tools that overlap or subscriptions that are oversized relative to your actual needs.
- Audit your advertising spend: A marketing campaign with no clear return on investment is nothing more than a disguised fixed cost. It’s time to cut what isn’t working and reinvest that budget in the channels that actually bring you customers.
Rigorous financial tracking, like what Bizyness enables, is your best ally for uncovering these recurring expenses that eat into your margin without you even noticing.
Lever 2: Reduce your variable costs
Tackling variable costs is just as crucial, because it makes every sale individually more profitable. Even a small drop of a few cents can create a snowball effect and considerably boost your profit by the end of the year.
Every sale becomes more “efficient”: it contributes more toward covering your fixed charges. It’s one of the surest ways to strengthen the solidity of your business model.
A few concrete actions to put in place:
- Renegotiate with your suppliers: Are your order volumes increasing? That’s an excellent argument for getting better purchase prices. Don’t hesitate to play the competition.
- Optimize your logistics: Regularly compare carriers, consolidate your shipments, or rethink your packaging to lighten your parcels. Every gram saved translates into fewer euros on the bill.
- Analyze your payment gateway: Transaction fees can quickly become a significant cost item. An annual audit of the different solutions can reveal substantial savings.
Lever 3: Increase your margin
This is arguably the most powerful lever. Increasing your contribution margin is like shifting into a higher gear. And the most interesting part is that you can achieve it without even touching your costs.
The goal is simple: make sure every euro of revenue generates more margin to cover your fixed charges and produce profit. Among the most effective actions, it’s essential to learn how to optimize your conversion rate.
- Adjust your selling prices: Sometimes a slight price increase, if well justified by the quality of your product or service, can boost your margin without driving away your customers.
- Highlight your “star” products: You inevitably have products with a more comfortable margin. Identify them and give them a prime spot in your store.
- Develop upsell and cross-sell: Offering a complementary product (cross-sell) or a higher-end version (upsell) at the point of purchase is a powerful technique for increasing the average cart value, and therefore the margin generated by each customer.
How Bizyness spares you the headaches of profitability tracking
If you’ve ever spent hours on spreadsheets trying to track your profitability, you know how tedious and error-prone the exercise is. One misallocated cost, one copy-paste that goes wrong, and your entire financial picture is thrown off. Automation is no longer a luxury — it’s a necessity for running an e-commerce business with peace of mind.
That’s where Bizyness comes in. The tool connects directly to your revenue and expense sources: Shopify, Amazon, Stripe, PayPal… everything is centralized. It continuously pulls in all your transaction data, without you having to lift a finger. No more manual exports and reconciling numbers that never quite add up.
Smart cost classification
The crux of the matter is properly distinguishing a fixed cost from a variable cost. Bizyness radically simplifies this task. Thanks to its connections, the platform is able to identify and classify every financial flow for you:
- Variable costs, such as transaction fees, marketplace commissions, or shipping fees, are detected and automatically linked to each order.
- Your fixed costs, whether a software subscription, salaries, or your rent, are recognized as recurring charges and immediately categorized.
This automatic sorting is the foundation of any reliable profitability calculation. Without it, you’re flying blind.
With Bizyness, your break-even point, your break-even day, or your margin of safety are no longer indicators you calculate once a year. They’re living data, updated in real time and presented on clear dashboards.
VAT management, a detail that changes everything
A point that’s often underestimated is VAT management, especially with the complexities of the OSS/IOSS schemes for international sales. This is a classic mistake that artificially inflates your margin by underestimating your costs.
Imagine a brand selling directly on its PrestaShop site across Europe, with €25,000 in fixed charges. Without a precise tool, it’s not uncommon to see variable charges underestimated by 18%, notably due to poor VAT management. By automatically applying the correct VAT rates via IOSS, Bizyness can push the contribution margin ratio from 42% to 61%. The impact is direct: the break-even point is reduced by 30%. To go further on this topic, you can read this complete guide on calculating the break-even point.
Ultimately, you end up with financial reports that are always up to date and reflect the reality of your business. You make decisions based on facts, not estimates. It’s the shortest and least stressful path to profitability. Take a look at the different types of reports Bizyness can generate to grasp the full potential.
Your frequently asked questions about the break-even point
Even after breaking down the concept, there are often very concrete questions that remain unanswered. That’s completely normal. Here are direct answers to the most common questions online sellers ask.
Do I calculate my break-even point excluding or including VAT?
The question may seem simple, but it’s crucial. The answer is simple: always excluding VAT.
Think of it this way: the VAT you charge your customers never really belongs to you. You’re only collecting it on behalf of the government. Including it in your calculation would artificially inflate your revenue, which would completely distort the picture of your actual profitability. For everything to be consistent, your costs (fixed and variable) must also be considered excluding VAT.
Is my break-even point the same if I sell across multiple channels?
Absolutely not. And this is a major point of vigilance. Each sales channel has its own cost structure. Commissions on Amazon, transaction fees on Shopify, advertising costs specific to each platform… all of this directly influences profitability.
That’s why it’s essential to calculate a break-even point for each channel. It lets you see clearly, in black and white, where you’re actually making money and where you might need to adjust your strategy or investments.
How often should I recalculate my break-even point?
Your break-even point isn’t a snapshot, it’s more like a film. It moves along with your business. Aiming for a monthly recalculation is an excellent practice to stay agile. A quarterly review is the bare minimum.
Beyond this routine, recalculate it as soon as a significant change occurs: a rise in your carrier’s rates, the launch of a new product with a different margin, or even hiring a new team member. Having a tool that updates this data in real time is no longer a luxury, it’s a genuine strategic advantage.
Managing your profitability shouldn’t be a headache. With Bizyness, you can automate these calculations, monitor your key indicators at a glance, and make decisions based on reliable data for your growth. Discover how Bizyness can help you.
