

 Français
Break-even point in value: a practical guide
Learn how to calculate the break-even point in value to optimize your financial management, with practical examples and tips

The break-even point in value is simply the minimum revenue you need to generate to cover all your costs, whether fixed or variable. It’s the well-known financial equilibrium point where your business neither makes money nor loses it. In other words, your net result is exactly zero.
What is the break-even point in value?
Picture a tightrope walker moving carefully across a wire. That wire is your journey as an entrepreneur. The starting point represents the beginning of your fiscal year, and the destination is profit. The break-even point in value is that precise spot on the wire where you find perfect balance, without tipping into losses. Every euro of revenue you generate beyond this point moves you steadily toward profitability.

This indicator is far more than just a number in an accounting spreadsheet; it’s a genuine compass for any business owner. It’s a strategic management tool that helps you answer crucial questions:
- What’s the minimum revenue my business needs to survive?
- Are my selling prices high enough to cover all my costs?
- If I take on a new expense (a pricier lease, a new hire), what will the impact be on my profitability?
The key components of this indicator
To calculate your break-even point, you first need to fully understand three fundamental financial concepts. Think of them as the foundations of your financial balance. Without a solid grasp of these three pillars, your calculation will lack precision and could even mislead you.
The break-even point in value is a crucial financial concept for French businesses. It defines the minimum revenue needed to cover all expenses without generating a loss.
Let’s take a concrete example: a retailer selling trousers. Their annual fixed costs amount to €20,000 and their contribution margin ratio is 80%. To cover all expenses, they’ll need to reach €25,000 in revenue. This clear target lets them anticipate results and steer their business more effectively — a point that the experts at Squareup explain very well in their analysis on business management.
To make things clearer, let’s break down the essential elements in the table below.
Key components of the break-even point
This table summarizes the three financial pillars needed to calculate the break-even point, with clear examples for each category.
| Component | Description | Common examples |
|---|---|---|
| Revenue | The total of your sales of goods or services, always calculated before tax (excl. VAT). | Product sales, invoiced services, monthly subscriptions. |
| Fixed costs | Costs that stay the same whether you sell a lot or very little. | Rent, administrative staff salaries, software subscriptions, insurance. |
| Variable costs | Costs that move directly with your production or sales volume. | Purchase of raw materials, delivery fees, sales commissions. |
Clearly distinguishing these components is the essential first step to calculating a reliable break-even point that’s useful for your decision-making.
Calculating the break-even point in value
Tackling the calculation of the break-even point in value can seem intimidating at first, but the logic behind it is actually very straightforward. Imagine you’re building a bridge: you first need to assess the weight it will have to bear (your costs) before choosing the right materials to make it hold (your revenue).
The most direct method relies on a key formula. It’s the true cornerstone of your financial analysis, the one that gives you the exact revenue figure to reach for your business to break even, with neither loss nor profit.
Break-even point in value = Fixed costs / Contribution margin ratio
This formula is your best ally for turning raw accounting data into a clear, tangible sales target. Every element of this calculation matters and must be identified with great precision.
Breaking down the formula step by step
Before applying the formula, you first need to calculate an essential intermediate indicator: the contribution margin ratio. It represents the share of every euro of revenue that’s left over to cover your fixed costs and, once those are paid, to finally start generating profit.
Here’s how to go about it — it’s very simple:
- First, the contribution margin (CM): Revenue (excl. VAT) - Variable costs (excl. VAT)
- Then, the contribution margin ratio: (Contribution margin / Revenue) x 100
Once you have this ratio, the rest is child’s play. This percentage measures your business model’s ability to generate profitability on every sale.
Identifying your costs accurately
The biggest pitfall? Misclassifying your expenses. A single error here can completely skew the result and mislead you about your targets.
- Fixed costs: These are the costs you can’t avoid, the financial “background noise” of your business. Think of your premises’ rent, administrative staff salaries, or a software subscription like Bizyness. These costs stay the same whether you sell 10 or 10,000 products.
- Variable costs: These, on the other hand, move in step with your activity. They include, for example, the purchase of raw materials, delivery fees for your orders, or commissions paid to your sales staff. The more you sell, the higher they climb.
This distinction is the foundation of good business management. Let’s take the concrete example of a company with €50,000 in annual fixed costs and a contribution margin ratio of 60%. To break even, it will need to generate €83,333 in revenue (€50,000 / 0.60).
This infographic perfectly illustrates the path from the company’s costs to its equilibrium point.
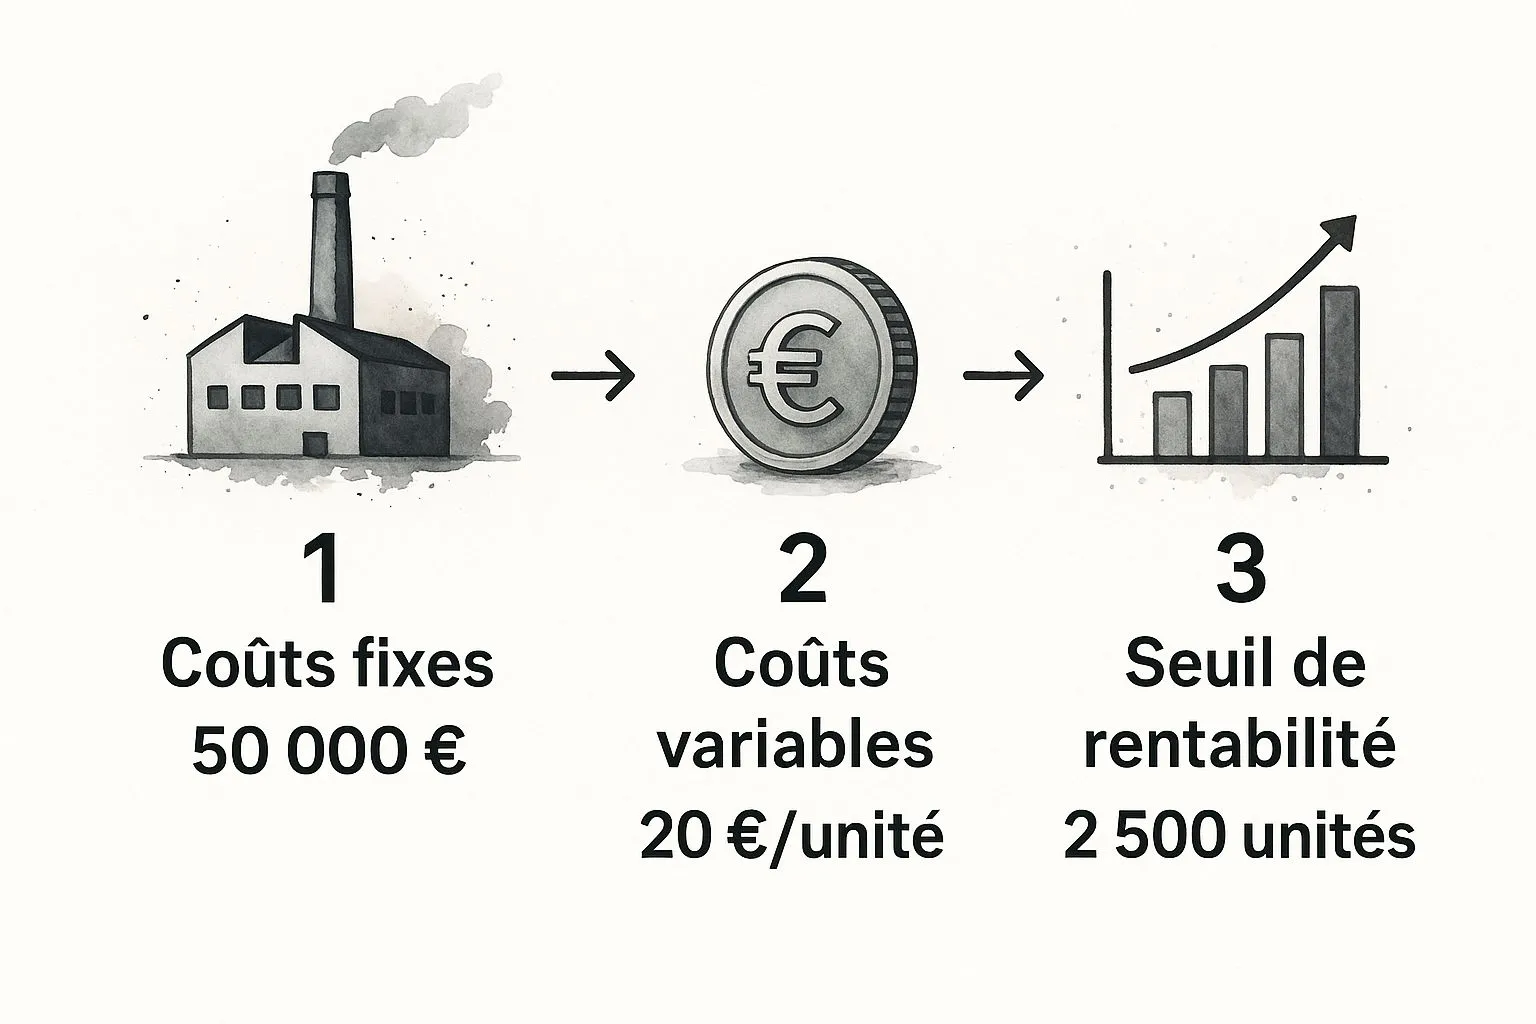
The image clearly shows that with fixed costs of €50,000 and variable costs of €20 per unit, the company needs to sell 2,500 units to reach its break-even point in volume. This figure then serves as the basis for calculating the break-even point in value.
Once you’ve mastered these few concepts, the calculation becomes second nature. To go even further and discover other approaches, feel free to check out our complete guide on calculating the break-even point — it’s an excellent resource.
Analyzing and interpreting your break-even point in value
You’ve calculated your break-even point in value. That’s an excellent starting point. But let’s be clear: this number, on its own, doesn’t tell you much. It’s a bit like knowing the altitude of a summit without having a map to get there. The real added value lies in knowing how to interpret it to turn it into a genuine management tool for your business.

Imagine your break-even point as your ship’s waterline. Knowing it is crucial, but it’s above all by understanding what it means for your speed, your cargo, and your route that you’ll navigate calmly, even in rough weather.
What does a high break-even point mean?
A high break-even point isn’t necessarily bad news in itself. What it reveals is that your business has significant fixed costs. In other words, you need to generate substantial revenue simply to pay unavoidable expenses like rent, salaries, or subscriptions.
This is a common situation in certain sectors, such as manufacturing or restaurants, where upfront investments are heavy. The main risk here is vulnerability. A small drop in activity can be enough to tip you into the red.
Think of a high break-even point as a warning light on your dashboard. It pushes you to keep a close eye on your margin of safety — that is, the surplus revenue you generate beyond this critical threshold. The wider this margin, the more solid your business is.
Use your break-even point to simulate the future
The real strength of this indicator lies in its ability to help you make informed decisions. It becomes a testing ground for exploring assumptions and answering strategic questions before committing a single euro.
Here are a few levers you can pull to optimize your profitability:
- Adjust your selling prices: A slight increase can sometimes lower your break-even point dramatically, because it directly boosts your contribution margin ratio.
- Reduce your variable costs: Good negotiation with your suppliers to lower the cost of raw materials means an improved margin on every sale. The effect is immediate.
- Control your fixed costs: Is your commercial lease negotiable? Could a cheaper software subscription do the job without hurting your productivity?
Every simulation gives you a clear view of the impact of your choices. For example, with a tool like Bizyness, all it takes is changing a price or a cost to see in real time how your break-even point in value shifts. An analysis that used to be static becomes a dynamic decision-making tool.
Don’t forget that the break-even point pairs well with another concept: the break-even time. While the former is expressed in euros, the latter translates it into a duration (in days or months). For more clarity, feel free to check out our article explaining the link between break-even time and break-even point. By combining these two indicators, you get a complete and precise picture of your project’s financial health.
Break-even point calculation examples by industry
Theory is one thing. But for the break-even point in value to become a truly concrete tool for you, nothing beats examples that speak to your daily reality. The reality is that cost structures vary enormously from one trade to another.
The real challenge is learning to correctly identify what counts as fixed costs and variable costs in your business. After all, the expenses of a consulting agency have little in common with those of a retailer or a construction contractor.
Let’s look together at how this indicator adapts to different business models.
The case of a consulting agency
For a consulting agency, everything revolves around selling time and expertise. Most costs are therefore tied to brainpower and the infrastructure that supports it.
- Typical fixed costs: Think of all the expenses that come due every month, whether you have clients or not. These naturally include the team’s salaries, office rent, software subscriptions (such as a CRM or a project management tool like Bizyness), and professional liability insurance.
- Typical variable costs: These are often smaller, but shouldn’t be overlooked. They might include commissions paid to a salesperson for a signed contract, travel expenses for a specific client assignment, or the cost of a freelancer brought in for a one-off project.
Here, the goal is clear: make sure fees billed comfortably cover fixed costs, since variable costs are generally lower.
The case of a retail business
A shop, whether it has a storefront or an online presence, has a completely different cost structure. Inventory is at the heart of the operation and represents a massive share of expenses.
- Typical fixed costs: You’ll find the usual suspects: premises rent, salaries, insurance, and various subscriptions. Often added to these are payment terminal fees or e-commerce platform monthly charges.
- Typical variable costs: Variable cost number one is, of course, the purchase of the goods you’ll resell. Add to that packaging costs, delivery costs, and any sales commissions if you sell through a marketplace.
In this context, calculating the break-even point is absolutely crucial for setting the right selling price — one that leaves you a comfortable margin once the product is paid for.
The case of a construction business
The construction sector is a textbook case showing just how vital a well-managed break-even point in value is. Projects are often substantial, with high investments and direct costs. Fixed costs, such as equipment rental or permanent team salaries, weigh heavily on the balance.
For a construction business, the break-even point isn’t just a number in a spreadsheet. It’s the minimum number of projects that need to be signed for the year to be viable.
Let’s take a concrete example. Imagine a business with €100,000 in annual fixed costs. The average selling price of a project is €20,000, and variable costs (materials, subcontractors) come to €8,000 per project. A quick calculation shows that nearly 9 projects will be needed just to cover expenses. In value terms, that represents minimum revenue of around €180,000. To go further on this topic, feel free to check out the details on the break-even point in construction.
This projection makes it possible to anticipate the required workload and better manage cash flow throughout the year.
To summarize these differences, here’s a table outlining the specifics of each sector.
Comparison of break-even point calculations by industry
| Industry | Fixed cost examples | Variable cost examples | Calculation specifics |
|---|---|---|---|
| Services (consulting) | Salaries, rent, software subscriptions | Commissions, one-off subcontracting | The contribution margin ratio is often very high, since variable costs are low. The main lever is the daily rate. |
| Retail | Rent, salaries, e-commerce fees | Purchase of goods, packaging, delivery | The cost of purchasing goods is the main variable. Unit margin is the key element to watch. |
| Construction | Salaries, equipment depreciation, insurance | Materials, subcontracting, equipment rental | Both fixed and variable costs are very high. The calculation should be done per project to manage overall profitability. |
This table highlights that, while the break-even point formula is universal, its application must be adapted to your business’s financial structure to be relevant.
The break-even point, a strategic tool for your management
Too often, the break-even point in value is seen as just a line in an accounting spreadsheet. Big mistake. It’s actually a genuine dashboard for any business owner who wants to steer their company with a clear vision. It’s a bit like your ship’s compass: it tells you where the equilibrium point lies, but more importantly, it helps you chart your course, avoid obstacles, and reach your goals.

From the very creation of your project, this tool is fundamental. When you build it into your business plan, it gives your financial forecasts instant credibility. It proves to banks or investors that you have a firm grasp of your business model and know exactly what revenue target to aim for to make your business viable.
Setting realistic, concrete sales targets
The break-even point has the power to turn a somewhat vague ambition, like “increase sales,” into a precise and perfectly tangible target. Let’s say your break-even point is €120,000 a year. Your mission becomes crystal clear: generate at least €10,000 in revenue every month, just to cover your costs.
From there, you can build out your entire sales and marketing strategy. How many new customers do you need? What should their average basket be? These questions finally get precise answers, letting you allocate your resources (ad budget, prospecting time, etc.) much more wisely.
Managing your business through the margin of safety
Once your revenue crosses that famous break-even point, the magic happens. Every additional euro sold flows directly into your profit. This surplus has a name: the margin of safety. It’s your financial cushion, your comfort zone that protects you from hard knocks.
The margin of safety is the best indicator of your business’s solidity. The bigger it is, the better equipped you are to absorb a drop in activity, an unexpected rise in costs, or a late payment without your financial balance being threatened.
This margin also tells you very clearly how much of a revenue drop you can afford before slipping into the red. That’s crucial information for navigating calmly in a market that can sometimes be unpredictable.
Adjusting your strategy in real time
The market shifts, your costs evolve, and so do your prices. Your break-even point is therefore not a figure frozen in time. You need to recalculate it regularly, especially in the following situations:
- Your fixed costs increase: you hire a new team member, you rent new premises, etc.
- Your variable costs change: the price of your raw materials climbs or your delivery fees go up.
- You change your pricing policy: raising your rates can lower your break-even point, while a promotion will have the opposite effect.
By keeping an eye on this indicator, you can anticipate your cash flow needs and continuously adjust course. A well-monitored break-even point is also a pillar for building a robust financial forecast, essential to sound business management, as we explain in our guide on the simplified balance sheet. Financial management then shifts from a mere legal obligation to a genuine growth lever.
Your frequently asked questions about the break-even point in value
The break-even point in value is a concept that often raises quite a few questions among entrepreneurs. That’s completely normal! To help you see things more clearly, we’ve gathered the most common questions, with simple, direct answers.
What’s the difference with the break-even point in volume?
This is a classic point of confusion, but it’s crucial to clearly distinguish between the two. They don’t give you the same compass for guiding your business.
Think of it this way: the break-even point in value is your target in euros. It’s the revenue (excluding VAT, of course) you need to reach for your income to cover all your expenses. Beyond that amount, every additional euro becomes profit.
The break-even point in volume, on the other hand, is counted in units. It’s the precise number of products to sell or services to deliver to reach equilibrium. One is a financial target, the other a sales target.
How do you account for seasonality in the calculation?
Many businesses, whether in tourism, restaurants, or retail, live by the rhythm of the seasons. If that’s your case, calculating a single break-even point for the whole year risks giving you a distorted picture of reality.
The trick is to break it down. Calculate it quarterly, or even monthly if your activity fluctuates a lot. You’ll then get much more relevant and achievable revenue targets, adapted to the ups and downs of your calendar. You’ll know precisely how much effort to put in during peak season to fund the quieter periods.
By adjusting your calculation for seasonality, you turn a simple number into a genuine dashboard. It’s the key to anticipating your cash flow needs and focusing your marketing efforts where they’ll have the most impact.
How often should it be recalculated?
Your break-even point isn’t a figure set in stone. It lives and breathes at the same pace as your business. It’s therefore wise to reassess it at least once a year, for example when preparing your new fiscal year.
But be careful — there are times when it needs updating without delay. A recalculation is called for as soon as an important parameter changes:
- Your fixed costs increase? New premises, a new team member joining…
- Your variable costs shift? The price of your raw materials climbing…
- You change your prices? A special promotion or a rate increase…
Recalculating it regularly ensures you’re always steering your business with the right information.
Is it useful for launching a new product?
Absolutely! It’s actually one of the smartest applications of this indicator. Before diving in body and soul (and financially) into a new project, calculating its projected break-even point is an essential step.
You estimate the fixed and variable costs tied to the launch (production, marketing, etc.), you set a selling price, and the calculation instantly tells you how many units you’ll need to sell for the venture to be profitable. It’s a very concrete way to test the soundness of your idea and make a decision on solid ground.
Don’t let administrative complexity slow your growth any longer. With Bizyness, automate your invoicing, cash flow tracking, and VAT calculations in just a few clicks. Join the thousands of independent professionals who manage their business with peace of mind and focus on what really matters: your craft.
