

 Français
Excel Inventory Management: Optimize Your Stock Efficiently
Learn to master Excel inventory management with our complete guide. Tips and formulas for accurate, easy-to-implement stock tracking.
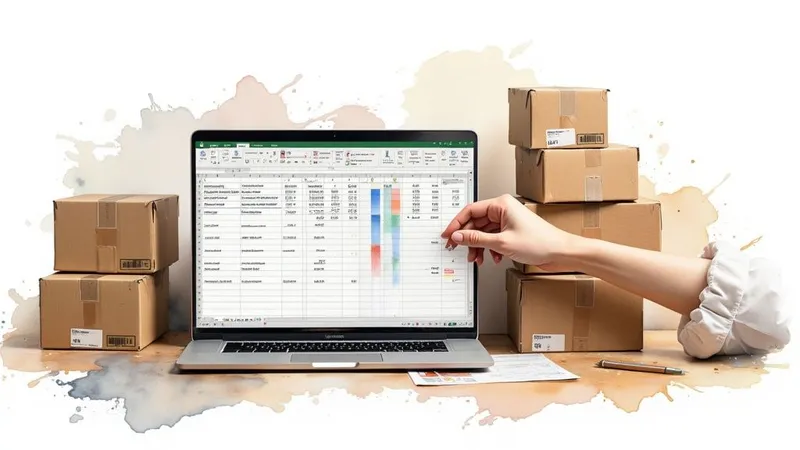
Managing your stock with Excel is something of a rite of passage for many small businesses. It’s the simple, effective and above all economical method to start tracking your products without breaking the bank on complex software. To get started on the right foot, structure your inventory and avoid the first stockouts, it’s often the best entry point.
Why Excel remains a safe bet for starting stock management

In the age of powerful management software, you might think Excel is ready for retirement. And yet, for many SMBs, artisans or young e-commerce sellers, it remains tool number one. The reason is simple: it’s flexible, familiar and costs practically nothing.
No need to subscribe to a new service or plan days of training. Excel is probably already installed on your computer. For a business starting out with a hundred or so SKUs, this advantage is huge.
The essential first step toward controlled inventory
Take the example of an artisan who has to juggle raw materials, or an online seller with a well-defined product range. A well-designed Excel file gives them a clear, immediate view: what’s in stock, what’s leaving, and above all, when to reorder.
It’s a pragmatic approach that lays healthy foundations for your management, without drowning in the complexity of an ERP system.
This method has proven itself time and again. Did you know that in France, between 60% and 75% of micro-businesses still rely on spreadsheets to track their inventory? Rigorous tracking on Excel can even cut stockouts by nearly 20% in just a few months, simply by setting up visual alerts and reorder thresholds.
Excel for stock management: pros and cons
This table compares the strengths and weaknesses of Excel for inventory tracking, helping you quickly decide whether this tool fits your current situation.
| Key advantages | Limitations to consider |
|---|---|
| Near-zero cost: already included in the Office suite. | Risk of manual errors: a wrong formula or typo can throw everything off. |
| Total flexibility: you build the table that exactly matches your needs. | No real time: updates entirely depend on human action. |
| Quick to learn: most people already have basic Excel skills. | Lack of collaboration: hard for several people to work on the same file simultaneously. |
| Ideal for starting out: perfect for small structures with a limited product volume. | Limited scalability: quickly becomes unmanageable with thousands of SKUs or multiple warehouses. |
In short, Excel is a fantastic tool to start with, but it’s important to know its limits to recognize when it’s time to move on to something else.
Of course, Excel is not a miracle solution. It shows its limits when the number of SKUs explodes or operations become more complex. It’s then wise to see it as a stepping stone.
When needs evolve and management gets more complicated, it quickly becomes essential to migrate to more robust, automated solutions. To prepare for that, feel free to check out our comparative guide to business management software. But to get started, stock management on Excel gives you immediate control and clarity you won’t regret.
Preparing the ground: the foundation of your stock file

For an Excel stock management file to be truly reliable, it must above all be well thought out. It’s like the foundations of a house: if the base is solid, everything you build on top will hold up. The goal is to create a logical system where every piece of information has its place. That’s what will later let us automate a good part of the work.
Many people make the mistake of centralizing everything on a single spreadsheet. That’s a false good idea. Instead, I strongly recommend opting for a structure with three distinct sheets, each with a precise role. This separation will make your file clearer, more responsive and, above all, much less vulnerable to handling errors.
The three pillars of effective stock tracking
Your file will therefore be built around three fundamental tabs. Think of them as three departments that communicate with each other to form a complete, coherent system.
- The product database: This is the reference catalog of all your items. Each product is listed on a unique row, identified by a code that never changes.
- The movements log: This is the beating heart of your inventory. Each row records a single operation: a goods receipt, a sale, a return…
- The dashboard: This is where the magic happens. This sheet consolidates all the information to give you a clear, synthetic view of your stock status at a glance.
By the way, there’s no shame in drawing inspiration from existing templates to get started. A 2023 survey showed that 45% of French business owners use a free template to get going, while 30% adapt one to their needs. These files, even basic ones, often include the essential columns (reference, quantity, date) and can already save up to 30% of time on administrative stock management each week. If you’d like to dig deeper, you can discover more details on organizing stock entries and exits.
Expert tip: From the start, get into the habit of putting your data into a Structured Table (go to
Insert > Table). It’s a simple reflex that changes everything. Your formulas will become dynamic and adjust automatically as you add new products or new transactions. A phenomenal time saver in the long run.
How should you concretely structure your spreadsheets?
For the system to work, each sheet needs specific columns. Here’s what I recommend as a starting point.
Sheet 1: The product database (Products_DB)
This is your master reference. The golden rule: one product = one row. No duplicates!
Product_Ref: A unique code that will never change (for example, TSH-BL-M).Description: The full, clear name of your item.Supplier: The main supplier for this product.Purchase_Price_Excl_VAT: Your unit purchase cost, excluding tax.Initial_Stock: The quantity you had when the file was created.Alert_Threshold: The stock level that should alert you it’s time to reorder.
Sheet 2: The movements log (Movements)
This is where you record everything. Every movement, incoming or outgoing, must be logged here.
Movement_Date: The date the operation took place.Movement_Type: “In” or “Out”. A small tip: use data validation to create a drop-down list. It prevents entry errors.Product_Ref: The code of the item concerned.Quantity: The number of units in or out.Comment(Optional but handy): To add a useful note (e.g. “Customer sale #1234” or “Defective supplier return”).
By laying these solid foundations from the start, you ensure you have clean data ready to be put to use. The next step, the most interesting one, will be to link these sheets with formulas so your stock updates itself.
The Excel formulas that will automate your inventory
Your stock management file is now well structured. It’s time to shift up a gear and turn it into a smart system that works for you. Formulas are the engine that will turn your simple table into a real management tool, both dynamic and reliable.
Forget endless manual calculations and the constant risk of human error. By mastering just a few key functions, you’ll automate the most critical tasks: calculating stock in real time, pulling up the right product info, and even creating alerts so you never run out of stock again.
The SUMIFS formula for real-time stock calculation
The first thing to do is know, at any moment, what you have left in stock for each product. Doing the calculation by hand (entries minus exits) is a huge source of errors. For this mission, your best ally is called SUMIFS.
This function lets you add up values based on several criteria. Concretely, you can ask it to calculate the sum of all entries for reference “TSH-BL-M”, then subtract the sum of all exits for that same reference.
The result? Stock that updates continuously, without you having to lift a finger. Every time you add a row to your movements log, the stock updates. Automatically.
To better visualize how it all fits together, take a look at this infographic. It shows how these key formulas chain together to automate tracking.
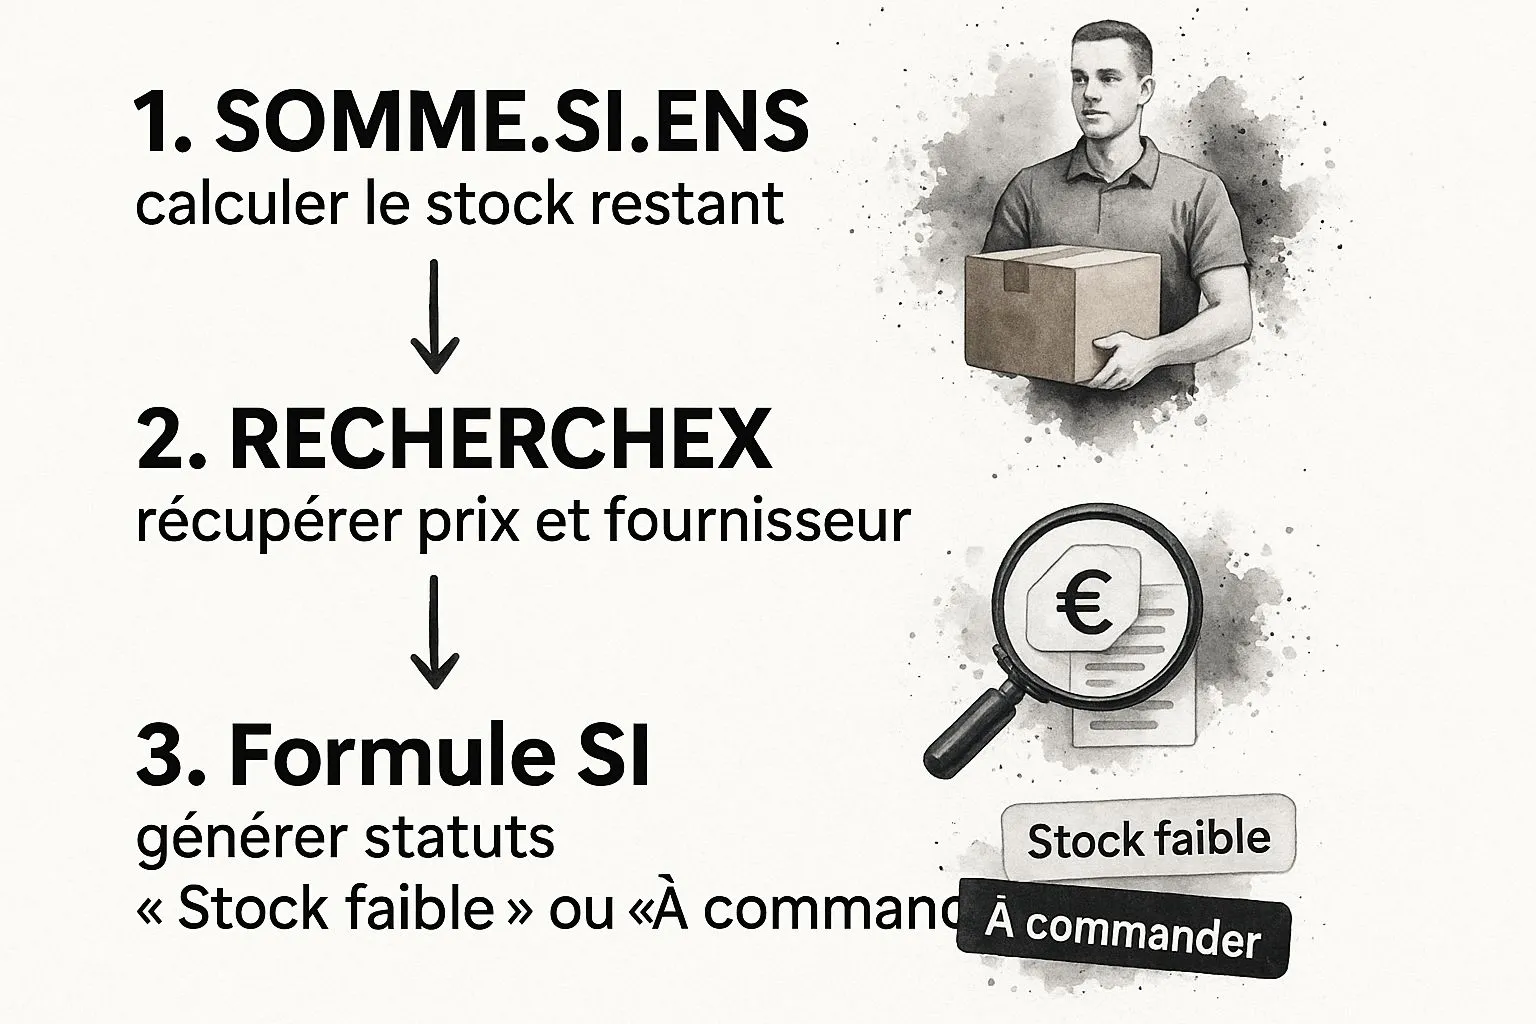
This diagram clearly shows how each function picks up where the previous one left off to create an Excel stock management system that is both coherent and autonomous.
Retrieving product info with XLOOKUP
Now that your stock is always up to date, you need to be able to easily retrieve information linked to your products, like the supplier name or purchase price, without having to juggle between tabs. That’s exactly the role of the XLOOKUP function.
More modern and much more flexible than the old VLOOKUP, XLOOKUP lets you find a value in one column (for example, the product reference) and return information located in another column (like the supplier name).
Imagine you want to display the supplier name next to each product in your dashboard. The XLOOKUP formula will simply look up the reference in your database and automatically display the correct supplier name. It’s direct, fast, and it avoids entry errors.
This function quickly becomes essential for enriching your dashboard with reliable data pulled directly from your product database. Consistency is guaranteed.
Creating smart alerts with the IF function
The real potential of your Excel stock management file is revealed when it becomes proactive. It shouldn’t just tell you what you have, but also what you should do. That’s where the IF function changes the game.
Combined with the stock calculation seen just before, you can create automatic statuses. The logic is simple:
- IF the current stock is less than or equal to your alert threshold, THEN Excel displays “To reorder”.
- ELSE, it displays “Stock OK”.
You can even go further and nest several conditions to get more precise statuses:
- Low stock: when approaching the critical threshold.
- Out of stock: when stock drops to zero.
- Overstock: if the quantity in stock exceeds a ceiling you’ve set.
These statuses turn a simple column of numbers into a real decision-support tool. Automating these small tasks is a fundamental first step toward gaining efficiency day to day. By the way, if the topic interests you, our complete guide to business process automation will show you how to apply these same principles on a larger scale in your business.
Thanks to these three formulas, your spreadsheet is no longer just a simple notebook. It becomes a smart assistant that watches your stock, warns you when action is needed, and helps you make the right decisions at the right time.
Visualizing your data with alerts and a dashboard

The formulas that calculate your stock in real time are in place. Perfect. But to truly steer your business, this data needs to speak to you. A long list of numbers, even an accurate one, remains tedious to interpret at a glance. The key is to turn this raw data into visual, immediately actionable signals.
This is where your Excel stock management file moves from a simple spreadsheet to a real strategic tool. With a few tweaks, you can highlight crucial information and build a dashboard that tells you everything you need to know to make the right decisions.
Setting up visual stock alerts
One of Excel’s most powerful, yet often overlooked, features is conditional formatting. The principle is simple: change the appearance of a cell (its color, for example) based on what it contains. For managing stock, it’s a small marvel.
Imagine scrolling through your item list. Instead of reading every row to spot low levels, your eye is immediately drawn to the products that have turned red. It’s simple, incredibly effective, and it prevents you from missing critical information.
To set this up, the steps are very straightforward:
- First, select the entire column containing your current stock.
- Go to the
Hometab, thenConditional FormattingandHighlight Cells Rules. - There, choose
Less Than.... - A window opens. Don’t type a hard-coded value! Click the small icon to the right of the field and select the alert threshold cell for the first item on the list.
- Finally, choose a format that stands out, like “Light Red Fill with Dark Red Text”.
And there you go. Excel will apply this rule to your entire selection, intelligently adjusting the reference to the alert threshold for each row. The result is instant: any reference that drops below its critical threshold will change color.
This simple visual automation can drastically reduce forgotten reorders. It turns an active monitoring task into an alert system that works for you at all times.
Building a dynamic, relevant dashboard
A good dashboard doesn’t need to be overloaded. Its goal is to give you a complete overview of your inventory’s health in under 30 seconds. To get there, your best allies are pivot tables and charts. They pull their info directly from your data sheets (Products_DB and Movements) and refresh with a single click.
Don’t fall into the trap of wanting to measure everything. Focus on the key performance indicators (KPIs) that really matter, the ones that have a real impact on your business.
Here are a few relevant KPIs you can easily set up:
- Total stock value: To know how much money is “sleeping” in your warehouse.
- Top 5 best-selling products: To identify your champions and make sure they’re never out of stock.
- Number of products in alert or out of stock: A simple counter to know how many references need immediate action.
- Stock turnover: A more advanced indicator to measure how fast you’re moving your merchandise.
The stock KPIs to track
This table summarizes the essential stock-tracking KPIs, their strategic role, and a simplified calculation method for your Excel file.
| Indicator (KPI) | Its usefulness for your business | Simplified calculation example |
|---|---|---|
| Stock value | Measure the capital tied up in your inventory. | =SUMPRODUCT([Current_Stock];[Purchase_Price_Excl_VAT]) |
| Stock turnover | Assess the efficiency of your management. A high ratio is often a good sign. | Cost of goods sold / Average stock value over the period |
| Stockout rate | Identify how often you’re missing sales due to lack of product. | (Number of out-of-stock products / Total number of products) * 100 |
| Top products | Highlight your “best-sellers” to optimize orders and marketing. | Use a pivot table to rank sales by product. |
| Dormant products | Spot items that aren’t selling and are tying up cash. | Filter products with zero outgoing movement over the last X months. |
By tracking these few metrics, you’ll already have a clear, precise view to guide your decisions.
To go further on how to structure these elements, take a look at our guide on creating an effective management dashboard. You’ll find concrete advice on turning your data into a true cockpit for decision-making.
A good dashboard is the brain of your Excel stock management system. It centralizes information and lets you move from simple observation to informed action.
Maintaining the reliability of your Excel file over the long term
A good Excel stock management file is a bit like a garden: it needs daily care to stay relevant. A perfectly designed tool at the outset can quickly become a headache if you don’t establish a certain discipline. The real key isn’t so much the complexity of the formulas as the rigor of the human processes that feed it.
Here’s the golden rule: log every movement, every entry, every exit, immediately. Never wait until the end of the day, let alone the end of the week. That’s the surest way to forget a transaction and create discrepancies that will throw off all your calculations.
Auditing and protecting your data
Even with the best of intentions, discrepancies will eventually appear between your theoretical stock in Excel and reality on the ground. That’s a given. To keep your file reliable, there’s no secret: you need to schedule regular physical inventories.
- Rolling inventories: This is a practice I highly recommend. Instead of bringing your whole business to a halt for one massive annual inventory, you count a small portion of your stock every week or every month. The advantage? It’s much more flexible and lets you spot problems (theft, errors, losses) much faster.
- The full annual inventory: It remains a mandatory step, if only for your accounting close. It’s the big clean-up that lets you reset all the counters and start the following year on solid footing.
Protecting your file is another critical point. We’ve all experienced that moment of panic after accidentally deleting a column full of formulas… Fortunately, Excel has you covered.
Remember to use the protection features. You can lock an entire sheet or, even better, only certain cells. For example, lock all cells containing calculation formulas (like your current stock) but leave the entry cells (incoming/outgoing quantities) accessible. It’s a simple reflex that will save you a lot of cold sweats.
Ensuring performance and evolution of the file
Over the months and years, your movements log will grow heavier, and your Excel file risks becoming slower and slower. To avoid this, a good habit is to archive old data. At the end of each year, for example, copy and paste all of the past year’s movements into a separate archive file.
Your main working file will stay light and responsive, while still letting you consult the history if needed.
Finally, your tool isn’t set in stone. It should evolve with your needs. If you notice you’re spending your time doing the same manipulations to produce a report, that might be a sign it’s time to look into macros.
You don’t need to be an expert developer. A simple recorded macro can automate a series of clicks and save you a huge amount of time, while limiting the risk of error. It’s your file that should adapt to you, not the other way around.
Frequently asked questions about Excel stock management
Even with the best tutorial in the world, you often run into very concrete questions once you get your hands dirty. That’s completely normal. I’ve gathered here the most frequent questions to help you resolve the situation and fine-tune your own tracking system.
The idea is to give you direct, ready-to-use answers, whether you’re creating your first file or looking to improve the one you’ve been using for months.
How do I track batches or expiration dates?
Ah, perishable products… a classic! The simplest and most effective way to handle this is to add two columns to your Movements sheet: one for Batch_Number and another for Expiration_Date. Doing this, each stock entry is clearly identified.
The little extra? On your dashboard, you can play with conditional formatting so that batches nearing expiration jump out at you. A small formula like =TODAY()+30>=[Expiration_Date] will automatically highlight all products that need to be sold within the next 30 days. It’s remarkably effective for limiting losses.
A word of caution: if several people need to update the file, it can quickly turn into chaos. My recommendation is simple: switch to Excel Online or share the workbook via OneDrive or SharePoint. These solutions let you work together in real time and keep a history of changes. No more version conflicts or data accidentally overwritten!
Can Excel handle stock with many variants?
Yes, no problem! But it requires a certain rigor in organization. Let’s take a concrete example: you sell t-shirts in different sizes and colors. The mistake to avoid is creating a row for “Blue t-shirt”.
The best practice is to create a unique reference (a SKU, or Stock Keeping Unit) for each variant. For example, TSH-BLE-M for the blue model in size M, and TSH-BLE-L for size L.
By adopting this logic, each variant is treated as a standalone item. Your stock calculations will be accurate, and your reports much more reliable. You can then use filters or pivot tables to analyze at a glance what sells best by size or color.
What should I do if my Excel file becomes too slow?
A file that lags is often a sign it’s overloaded. Either there’s too much data, or formulas that are too calculation-heavy. Don’t panic, there are several ways to lighten it:
- Archive old data. No need to keep five years of history in your active file. Simply move previous years’ movements into another workbook. Your working file will regain its speed.
- Watch out for volatile formulas. Functions like
TODAY()orRAND()force Excel to recalculate everything at the slightest change. Use them wisely and only when essential. - Adopt structured tables. It’s a habit worth building. Formulas based on table names (like
Table1[Quantity]) perform much better than those targeting entire columns (likeC:C).
With these few adjustments, your Excel stock management tool will remain a fast, effective ally over the long term.
If, despite everything, manual management on Excel is starting to weigh on you and take up too much time, that might be the signal that it’s time to move to a more integrated solution. With Bizyness, for example, you can automate your invoicing and accounting to finally focus on what really matters: growing your business. Discover how Bizyness can simplify your daily life.
