

 Français
Financial Dashboard Example: The Complete Guide to Steering Your Performance
Discover how to build and optimize an effective financial dashboard with concrete examples and proven strategies. Learn to turn your data into actionable insights for better decision-making.

The fundamentals of a financial dashboard that inspires confidence
A good financial dashboard is an indispensable tool for running a business effectively. It lets you track results and make the right decisions at the right time. Here are the essential elements for building a relevant and reliable dashboard.
The key indicators to watch
The first step is choosing the performance indicators (KPIs) that truly matter for your business. These KPIs should reflect your strategic objectives and precisely measure your company’s financial health. For example, to optimize profitability, focus on gross margin and return on investment.
A clear, readable presentation
How you format your data is crucial. Favor simple tables, expressive charts, and an intuitive color code. The goal is to spot trends and points of attention at a glance. A good dashboard tells a coherent story about your business.
The right tools for analysis
Choosing the right tools is decisive for the dashboard’s effectiveness. Solutions like Microsoft Power BI or Tableau make it easy to build interactive, custom analyses. Pay particular attention to the visual aspect: an attractive dashboard will be used more by teams.
Adapting it to your industry
Every company is unique and needs a tailor-made dashboard. It should match your industry and your size. A complete dashboard notably includes the balance sheet with equity, which represents the company’s net worth. Assets and liabilities are classified by maturity to make tracking easier. A color code helps you visualize the financial situation at a glance. Learn more about dashboard templates
The key to an effective dashboard rests on reliable data, a clear presentation, and relevant analysis. By following these principles, you’ll have a genuine steering tool for your business.
Mastering the analysis of essential financial indicators

The financial dashboard is an essential tool for understanding the health of your business. It lets you track key figures and anticipate upcoming challenges. In-depth analysis of the indicators is therefore essential to making the right decisions.
Choosing the right indicators
The relevant indicators vary depending on your industry. For e-commerce, conversion rate and average order value are decisive. Service businesses, on the other hand, focus more on hourly rate and customer retention.
Analyzing the overall context
It’s important to look at the indicators as a whole. A rise in revenue combined with a drop in margin can signal cost or pricing problems. Cross-analysis helps you better understand the real situation.
Making informed decisions
The indicators should guide your strategic choices. A drop in the collection rate can signal cash flow risks and justify corrective action. Burkina Faso’s TBSEF 2022 illustrates this point: despite a 14.8% rise in revenue to 2,551.94 billion FCFA, a 24.2% increase in spending to 3,617.83 billion FCFA created a deficit of -1,065.89 billion FCFA. More information on the TBSEF 2022.
Adapting to your reality
The analysis should match your situation. A start-up will favor growth indicators, while an established company will focus on profitability. Tools like Bizyness let you customize your dashboard to your specific needs.
Strategically building your dashboard
Building an effective financial dashboard requires a methodical approach. A well-designed dashboard becomes a valuable tool for running your business day to day.
Defining your objectives and key indicators
The first step is identifying your tracking and analysis needs. Select the key performance indicators (KPIs) that reflect your objectives. For example, to improve profitability, monitor gross margin, cost of goods sold, and return on investment.
Choosing the right tools
The tools determine the quality of your dashboard. Solutions like Bizyness, Microsoft Power BI, or Tableau offer powerful analysis features. Evaluate your budget and technical needs before choosing. Bizyness suits small structures well, with its simple interface and built-in accounting features.
Automating data collection
Automation is the key to a reliable dashboard. Connect your systems (accounting, CRM) to avoid manual entry. This lets you focus on analysis rather than data compilation.
Visualizing and interpreting the data
A good dashboard presents information clearly. Use charts and color codes to make it easier to read. Line charts show revenue trends, pie charts break down cost distribution. In a business plan, financial tables are essential for assessing viability, particularly through the projected income statement and key management ratios. Discover more about the importance of financial tables in a business plan.
Maintenance and updates
Your dashboard should evolve with your business. Update it regularly, adjusting KPIs and presentation to your needs. A regularly updated dashboard lets you stay on top of your financial performance and make the right decisions to grow your business.
Smart customization for your unique context
A financial dashboard is only a starting point. To be truly useful, it needs to match your company’s particular needs. A dashboard’s effectiveness depends on its ability to adapt to your specific situation.
Choosing indicators based on your activity
For an online store, conversion rate and average order value are essential. A service company, on the other hand, will focus more on hourly rate and customer retention. Choosing the right indicators is the first step toward an effective dashboard.
Setting up appropriate alerts
Alert thresholds flag important changes in your figures. For example, a SaaS company will be more sensitive to customer churn than a traditional retail business. These alerts let you act quickly when needed.
Adapting the display for different users
A CFO needs a global view, while a salesperson focuses on sales. Custom views let everyone access the information relevant to their role. Bizyness lets you create these tailored views.
Integrating your specific indicators
Beyond standard indicators, add metrics specific to your business. A restaurant will track cost per plate, a transport company cost per kilometer. This data enables precise steering.
Concrete customization examples
- A factory added a scrap rate metric to optimize production
- A marketing agency tracks acquisition cost and advertising ROI for each client
- A start-up centralizes data from its tools (CRM, payments) for real-time tracking
Customization is an ongoing process. Don’t hesitate to evolve your dashboard as your needs change. Bizyness supports you with flexible features to build an effective steering tool.
Effective update and maintenance strategies
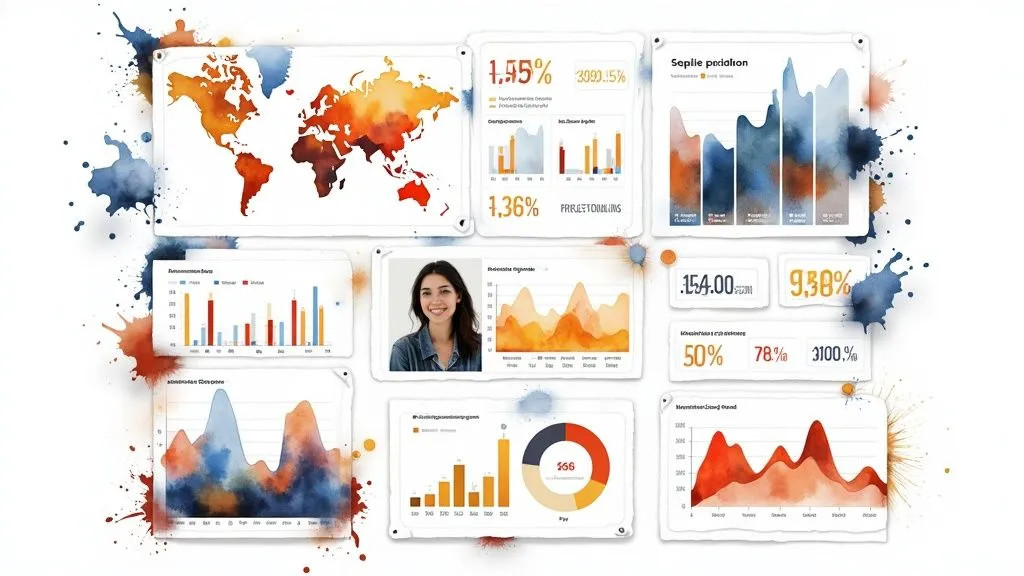
A financial dashboard only has value if its data is up to date. Without regular maintenance, it quickly loses its usefulness for decision-making. It’s therefore essential to set up simple, effective update procedures.
Automating data updates
Bizyness and other solutions let you connect your dashboard directly to your accounting and banking data sources. This automation considerably reduces the time spent on updates while minimizing manual entry errors.
Establishing quality controls
Even with automation, quality control remains necessary. Set up cross-checks between different data sources. Clearly define who is responsible for validating which information, and how often.
Training users
Training is essential for optimal use. Your teams need to master interpreting the indicators and using the features. Organize regular hands-on sessions so everyone can get the most out of the tool.
Setting the right frequency
The ideal update frequency varies by business. Some companies need daily updates, while others can make do with weekly or monthly updates. The key is finding the right balance between up-to-date data and workload.
Optimizing maintenance
Choosing the right tools is crucial for effective maintenance. Bizyness, for example, simplifies managing financial data. By centralizing information and automating repetitive tasks, you free up time for analysis.
Best practices to follow
- Set up alerts for data anomalies
- Document update and validation procedures
- Plan regular training sessions for users
- Regularly assess usage to identify possible improvements
By applying these recommendations, your dashboard will remain a reliable tool for steering your business. Up-to-date data and effective maintenance are essential for making the right strategic decisions.
Taking action and next steps

Now that we’ve explored the essential aspects of a financial dashboard, it’s time to put it into practice. This section presents a concrete approach for creating or improving your own financial dashboard, with clear steps for better managing your indicators.
Building an effective action plan
The first step is defining your objectives precisely. What results do you want to achieve with your dashboard? Better profitability? Optimized cash flow management? Once these objectives are set, determine the key indicators that will measure your progress.
- SMART objectives: Specific, Measurable, Achievable, Realistic, and Time-bound. For example: increase gross margin by 5% next quarter.
- Choosing KPIs: To track gross margin, monitor cost of goods sold and average selling price.
- Selecting tools: Choose a solution that fits your needs, such as Bizyness, with its simple interface and essential features.
Organizing regular follow-up
A financial dashboard must evolve constantly. Regular updates and analysis are essential to keep it relevant. Choose an update frequency that fits your business.
- Update rhythm: Daily, weekly, or monthly depending on your needs
- Reviewing the data: Spotting trends and areas for improvement
- Concrete solutions: Putting actions in place to reach your objectives
Managing potential obstacles
Setting up a dashboard can run into difficulties. It’s best to anticipate them in order to overcome them.
- Adapting to change: Explain the benefits to your teams and involve them in the project
- Data quality: Check the availability of the information you need
- Technical simplicity: Choose an easy-to-use tool like Bizyness, ideal for small and medium businesses
Evolving your dashboard
Your company changes, and your dashboard needs to keep up. It should remain an effective steering tool over the long run.
- Reviewing KPIs: Regularly question the usefulness of your indicators
- New options: Test your tool’s new features. Bizyness, for example, offers connections with online stores
- Industry watch: Keep an eye on best practices in your industry
By applying this advice, you’ll build an effective financial dashboard suited to your needs, letting you steer your business with precision. Start optimizing your financial management now with Bizyness.
