

 Français
Forecasted Income Statement Example: Expert Guide
Discover our forecasted income statement example to boost your financial forecasts and succeed in your strategy.

Decoding Forecasted Income Statements
Financial management is fundamental for every entrepreneur, whether in e-commerce, digital product sales, or services. The forecasted income statement has become an essential tool for steering a business effectively. Thanks to new management software, this tool—once reserved for experts—is now accessible to all entrepreneurs.
The key to an effective forecasted income statement lies in three major elements: the quality of the data used, the relevance of the assumptions, and adaptation to market realities. It is a living document that must evolve alongside your business. It not only gives you a clear view of your future finances but also helps you anticipate difficulties and identify growth opportunities.
In this practical guide, we will analyze 8 concrete examples of forecasted income statements tailored to different business models. You will learn to build a relevant forecast for your business, regardless of your accounting expertise. We will see how to use it in practice to:
- Optimize your day-to-day financial management
- Manage your invoicing efficiently
- Plan your long-term strategy
- Make the right decisions at the right time
Get ready to master this indispensable tool for your business’s success. With a solid understanding and regular use, the forecasted income statement will become your best ally for controlled financial management.
1. Format by nature
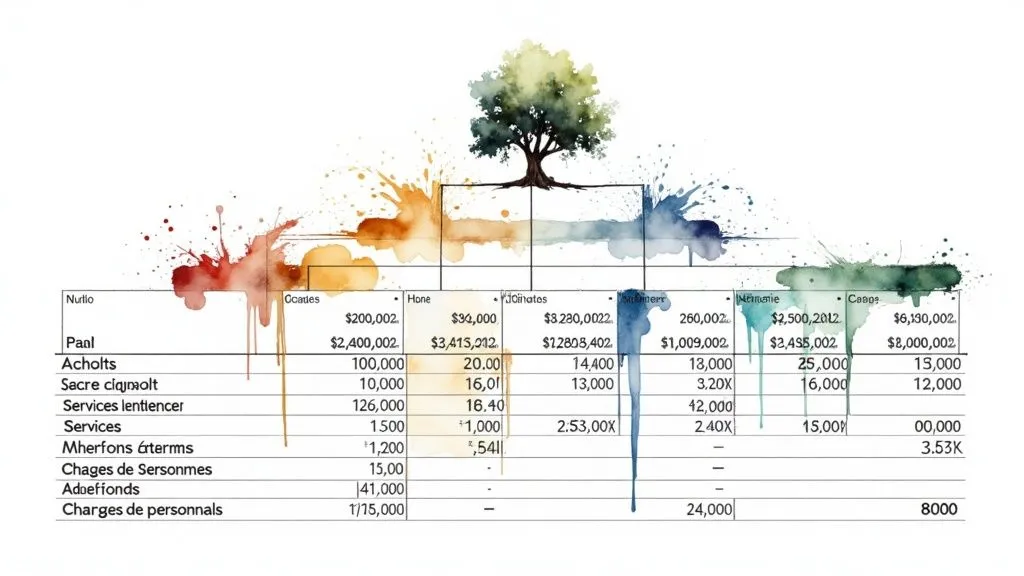
The forecasted income statement in the “by nature” format is a key method for anticipating a company’s financial performance. It classifies expenses and revenue by accounting type, following the rules of the French General Chart of Accounts (Plan Comptable Général, PCG). This format is particularly well suited to sole traders, freelancers, and small structures that want a clear view of their future profitability.
How it works and applies
The principle is straightforward: group accounting line items according to the categories defined by the PCG. Examples include “Purchases of goods,” “Personnel costs,” or “Revenue.” This organization allows for a standardized, easily readable presentation.
Concrete example
Take the case of an e-merchant selling handcrafted products. Their forecasted income statement might look like this (simplified figures):
-
Product sales: €100,000
-
Purchases of materials: €30,000
-
Personnel: €20,000
-
Rent: €5,000
-
Marketing: €10,000
-
Operating result: €35,000
Strengths
- Recognized format by banks and investors
- Simple to read thanks to its standardized structure
- Compliance with French accounting standards
- Easier comparison from one year to the next
Weaknesses
- Lack of analytical detail on the origin of expenses
- Sometimes distant view of operational reality for complex structures
Practical tips
- Group similar line items for greater clarity
- Include meaningful subtotals (gross margin, net result)
- Keep the same structure across several fiscal years
Key takeaways
This format is a solid foundation for small businesses. Its simplicity and recognition by financial institutions make it a valuable tool for managing growth. Although less detailed than other formats, it remains essential for understanding and projecting financial performance.
2. Format by function
The forecasted income statement format by function organizes expenses according to their role within the company. This approach focuses on how resources are used to achieve objectives, rather than on the nature of the expenses themselves.
For sole traders and growing SMEs, this format provides a clear, strategic view of finances. It makes it possible to identify precisely where budgets are allocated and to optimize costs in a targeted way.
Key points:
- Analysis by division: Costs are broken down by area of activity (production, marketing, administration, etc.)
- Management orientation: This method gives an overview of each function’s performance
- Profitability study: Linking revenue and costs by activity makes it possible to assess profitability
Pros:
- Overall view: Provides better understanding of resource allocation and helps identify opportunities
- Budget tracking: Offers detailed control of expenses by function
- Decision support: Provides key data for strategic choices
Cons:
- Complex to set up: Requires detailed cost accounting
- Precise tracking system: Requires suitable tools to track costs by activity
- Low standardization: Comparisons between companies are more difficult
Concrete applications:
International groups often adopt this format for their reporting. It helps investors better analyze the cost structure and profitability by activity.
Implementation tips:
- Choose the right software: Opt for a solution that allows cost-center tracking
- Track time: Set up a system for tracking hours by project
- Train your teams: Make sure everyone understands the importance of tracking by function
Example for an e-merchant:
| Function | Forecasted costs |
|---|---|
| Purchases | €10,000 |
| Marketing | €5,000 |
| Logistics | €2,000 |
| Administration | €1,000 |
| Total | €18,000 |
In summary, despite being more demanding to set up, this format offers a precise, strategic view of finances. It is particularly well suited to companies that want to analyze and optimize their performance by activity.
3. SIG format (Intermediate Management Balances)
The SIG format of the forecasted income statement makes it possible to analyze the formation of net income step by step. This method is particularly useful for sole traders, freelancers, and SMEs, as it offers a detailed view of profitability and helps in making sound strategic decisions.
The main elements of the SIG format:
The breakdown proceeds through several key indicators:
- Trading margin: The difference between revenue and the cost of goods sold. It reflects the effectiveness of your sales policy.
- Output for the period: Represents the value of goods and services created for production companies.
- Value added (VA): Trading margin + output – consumption. Measures the wealth created.
- Gross operating surplus (EBITDA-equivalent): VA – personnel costs. Assesses profitability before depreciation.
- Operating result: Gross operating surplus after accounting for depreciation and provisions.
- Financial result: The difference between financial income and financial expenses.
- Pre-tax ordinary result: The sum of the operating result and the financial result.
- Net result: The final profit after tax.
Concrete applications:
- Online retail: Analyzing the impact of prices on margin and assessing marketing actions via the gross operating surplus.
- Services: Tracking value added based on the volume of assignments and the rates applied.
Practical recommendations:
- Calculate ratios regularly: Net margin, trading rate, debt ratio.
- Compare with your sector: Use Chamber of Commerce (CCI) data to benchmark yourself.
- Track trends: Analyze trends over several fiscal years.
Why the SIG format matters
This detailed format makes it easier to understand performance and identify areas for improvement. Unlike a standard income statement, it allows for in-depth analysis at each stage of income formation, making it a valuable management tool.
This format is ideal for entrepreneurs who want a fine-grained understanding of their profitability and want to optimize their financial management. It fits perfectly with the varied needs of small and mid-sized businesses.
4. Business plan format
The “Business Plan” format is a simplified approach to the forecasted income statement. It is particularly useful for new entrepreneurs presenting their project to investors or banks. This format stands out from a standard income statement through its clarity and effectiveness.

Key points:
- Concise overview: The document presents only the crucial figures, such as revenue, variable and fixed costs, and net result
- Performance indicators: Highlights gross margin, break-even point, and key financial ratios
- Medium-term view: Offers projections over 3 to 5 years to assess growth potential
Strengths of the format:
- Easy to understand: Accessible to people without in-depth accounting training
- Practical for entrepreneurs: Lets you focus on strategy rather than accounting technicalities
- Effective for fundraising: Increases the chances of obtaining funding thanks to its clarity
Usage tips:
- Realistic assumptions: Base your forecasts on verifiable market data
- Multiple scenarios: Present at least a conservative version and an optimistic version
- Justify changes: Explain significant variations between years
Concrete applications:
BPI France and business incubators regularly use this format. For example, an e-commerce startup can project its growth over 3 years by detailing its customer acquisition assumptions. An independent consultant can plan their activity based on their planned assignments.
Why choose this format?
This format is ideal for entrepreneurs who need a simple tool to plan their business and convince financial partners. It strikes the right balance between data accuracy and ease of communication, making it a sound choice for sole traders, freelancers, and e-merchants.
5. Monthly cash flow format
The standard forecasted income statement shows projected profitability over a year. However, for sole traders, freelancers, and small businesses, a monthly cash flow format is essential. This format analyzes money coming in and going out month by month for better day-to-day liquidity management.
How it works:
The monthly format precisely details the expected receipts and disbursements for each month. It takes actual payment terms into account — for example, a sale made in January may not be paid until March, which directly impacts available cash.
Concrete examples:
- For an e-commerce freelancer: Take the case of an online trainer. Even with a significant annual profit, if most sales happen early in the year while expenses are monthly, they risk cash-flow difficulties without monthly tracking.
- For a services agency: A marketing agency with 30–60 day payment terms must absolutely track its cash flow month by month to anticipate incoming funds and adjust spending.
Growing popularity:
Modern accounting management tools have made this format more accessible. It allows businesses to adapt quickly to fluctuations in activity, especially those operating online.
Strengths:
- Better visibility: Clear view of short-term liquidity
- Financial anticipation: Identifying critical periods to plan for needs
- Easier management: Informed decisions on investments and hiring
Weaknesses:
- Requires regular updates: Forecasts must be refreshed frequently
- Complex to estimate: Requires good knowledge of customers’ payment habits
Usage tips:
- Update every month: Revise data based on actual results
- Note seasonality: Factor in seasonal activity variations
- Track actual timelines: Base estimates on the history of customer/supplier payments
Why it matters:
Mastering cash flow is vital for today’s entrepreneurs. This monthly format provides the precision needed to steer your business, anticipate difficulties, and make the right decisions. It’s an indispensable tool for sole traders, freelancers, and small businesses.
6. Multi-activity analytical format
A multi-activity forecasted income statement makes it possible to finely analyze the performance of each business line. This approach offers a much more precise, detailed view than a simple overall result, helping to steer profitability better and make informed strategic decisions.
How it works:
The method relies on segmenting activities. It involves isolating the revenue and expenses of each business line as distinct entities. This approach requires a rigorous allocation of indirect costs (rent, administrative salaries, etc.) based on relevant criteria such as revenue or headcount. The result is a fine-grained profitability analysis by segment.
Concrete applications:
Take the example of an online shop selling clothing and accessories. Multi-activity analysis might reveal that accessories, despite lower revenue, generate a better margin than clothing. This information would allow the marketing strategy to be adjusted to focus on accessories.
Similarly, an independent trainer offering both online courses and coaching might find that their courses, although requiring a significant upfront investment, prove more profitable in the long run than individual coaching.
Usage and adoption:
This method is gaining popularity as businesses diversify their activities, particularly in e-commerce. Modern management tools now make it easier to implement and automate.
Implementation tips:
- Choose suitable allocation keys reflecting actual resource usage
- Use accounting software that allows breakdown by activity
- Set up regular tracking of indicators by segment
- Get support from an expert for the initial rollout
Strengths and limits:
Advantages:
- Clear view by segment: Identification of high-performing activities
- Decision support: Better resource allocation
- Offer optimization: Adjustment based on actual profitability
Drawbacks:
- Allocation complexity: Requires fine-grained cost analysis
- Need for suitable tools: Investment in capable software
Despite its relative complexity, the multi-activity format brings an indispensable level of analytical precision for optimizing performance and making informed decisions. It is particularly relevant for entrepreneurs and SMEs managing several activities or product lines.
7. Digital dashboard format
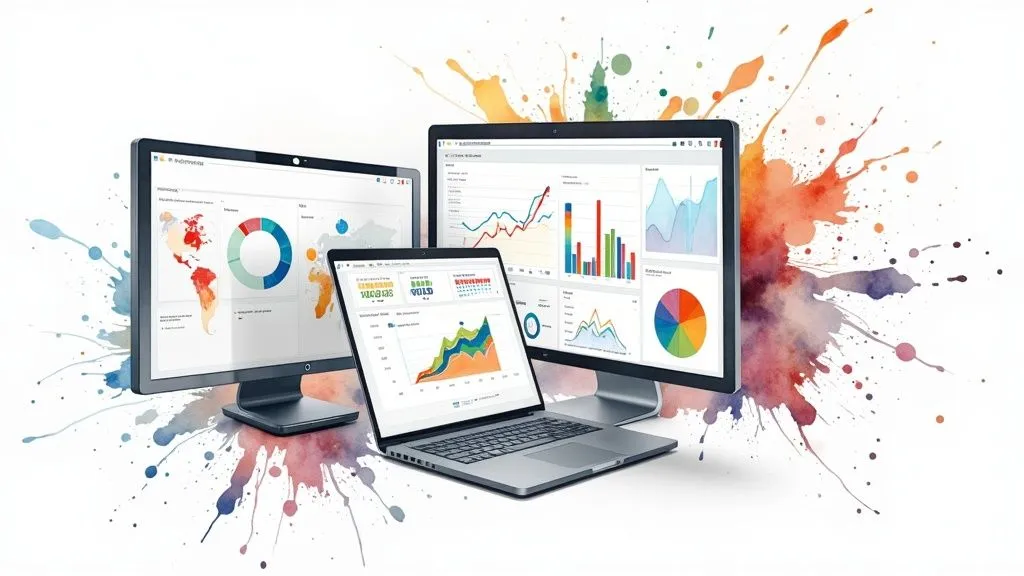
A paper-based forecasted income statement has its limits. To manage finances effectively, particularly in e-commerce or multichannel sales, a digital dashboard offers a more dynamic and interactive view of your financial data.
The digital dashboard format lets you track your income statement in real time with visualizations and key performance indicators (KPIs). You can monitor the evolution of your revenue, margins, and expenses at a glance.
Essential features:
- Graphic visualizations: Interactive dashboards, curves, pie charts, and bar charts to quickly understand your data
- Automatic updates: No more manual updates — data is refreshed live
- KPI tracking: Monitoring key indicators such as conversion rate or average order value
Strengths:
- Interactive: Filter and analyze your data in depth
- Real-time updates: Save time and avoid manual errors
- Customizable: Adapt the indicators to your needs
Weaknesses:
- Requires specific tools: Needs solutions such as Tableau or Power BI
- Initial costs: The investment can be significant for small structures
Concrete applications:
- An e-merchant analyzing sales by product and channel
- A consultant tracking revenue by client
- An SME comparing forecasts with actual results
Implementation tips:
- Identify your priority KPIs: Focus on the essential indicators
- Select the right tool: Compare solutions based on your needs
- Train your teams: Make sure everyone knows how to use the dashboard
Visualization tools are now more affordable and powerful. While the initial investment may seem high, the gains in efficiency and analytical precision make it a smart choice for businesses, particularly in e-commerce.
8. Startup/Lean format
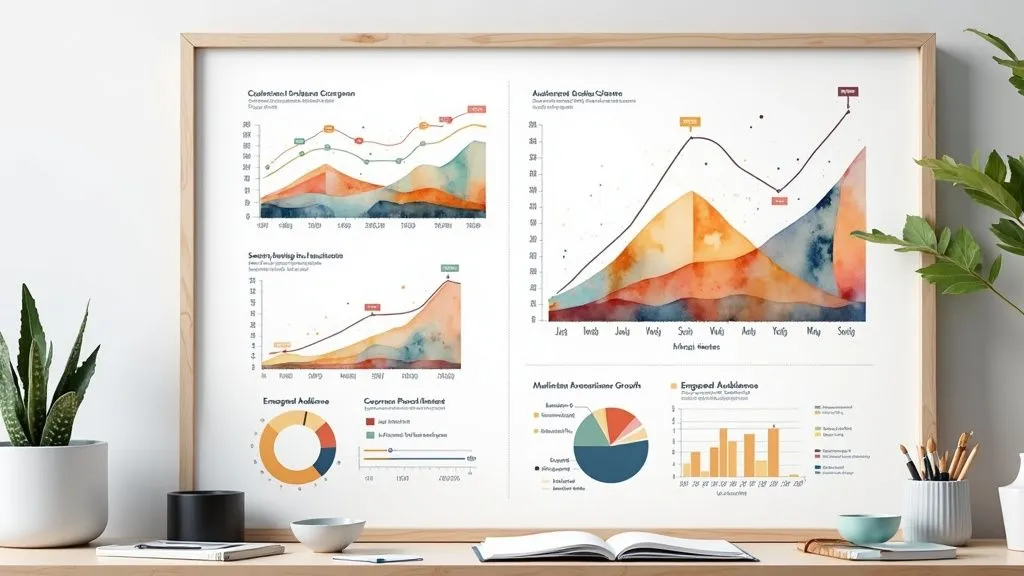
The Startup/Lean format offers a different approach to the forecasted income statement, specifically designed for young companies in their growth phase. This format emphasizes growth indicators over immediate profitability, making it a valuable tool for startups looking to validate their business model.
Key points to remember:
- Growth KPI tracking: Analysis of active user numbers, monthly recurring revenue (MRR), customer retention, and customer acquisition cost
- Acquisition measurement: Detailed assessment of marketing costs by channel to optimize the budget
- Development factors: Identification of key elements enabling rapid expansion
Main advantages:
- For emerging models: Perfect for quickly testing and adjusting new concepts
- Growth-focused view: Helps identify success factors to guide strategy
- Flexibility: Adjusts easily based on market feedback
Implementation tips:
- Prioritize progress indicators: Focus on figures that show your business’s evolution
- Analyze marketing costs: Precisely calculate the return on investment for each channel
- Cash management: Monitor your cash burn to anticipate your needs
Origin:
This method developed thanks to well-known accelerators such as Y Combinator and Station F, which have proven its effectiveness with numerous startups.
Concrete application:
Take the example of an organic e-commerce startup. Its forecasted income statement tracks indicators such as monthly customer acquisition, average order value, and retention rate. This data helps improve marketing campaigns and accelerate growth.
While very useful for startups, this format has its limits. It can downplay the importance of long-term profitability. It is therefore advisable to complement it with standard financial analyses as the company develops.
8-Format Comparison: Forecasted Income Statement
| Format | Implementation complexity (🔄) | Resources required (⚡) | Expected results (📊) | Ideal use cases (💡) | Key advantages (⭐) |
|---|---|---|---|---|---|
| Format by nature | Simple | Low | Standardized annual comparison | Financial institutions and traditional companies | Compliance with standards and ease of reading |
| Format by function | Complex | Moderate (cost accounting) | Strategic view and management control | Large companies and managerial analyses | Relevance for decision-making |
| SIG format (Intermediate Management Balances) | Moderate | Moderate (indicator tracking) | Detailed analysis of margins and profitability | Financial analysis and performance optimization | Clear view and identification of improvement levers |
| Business plan format | Simple | Moderate (3–5 year projections) | Forward-looking projections and fundraising | Startups and business creation projects | Ease of understanding and adaptation for non-financial audiences |
| Monthly cash flow format | High (frequent updates) | Moderate | Real-time cash flow tracking | Operational steering and cash management | Anticipation of funding needs |
| Multi-activity analytical format | Complex (multiple segmentation) | High (sophisticated tools required) | Profitability analysis by segment | Multi-activity groups and diversified companies | Segmented view and product mix optimization |
| Digital dashboard format | High (interactive digital) | High (technology investment) | Real-time visualizations and dynamic indicators | Companies seeking interactive, instant management | Interactivity, customization, and automatic updates |
| Startup/Lean format | Simple to moderate (agile approach) | Moderate | Growth metric tracking | Startups and innovative models | Growth orientation and agility |
“Choosing the right forecasted income statement for your business”
Choosing the right forecasted income statement example
To create an effective forecasted income statement, it’s essential to have a solid understanding of your business activities, costs, and revenue estimates. The key to success lies in choosing a model suited to your company’s specifics, whether by nature, by function, or designed for startups. The more accurate your data, the more reliable your forecasts will be.
To achieve meaningful results, you need to analyze your historical data and study market trends. For example, if you’re in e-commerce, don’t forget to factor in the impact of sales periods on your revenue. These seasonal elements can strongly influence your results.
The forecasted income statement must evolve alongside your business. Don’t be discouraged if your first forecasts aren’t perfect. What matters is regularly adjusting your estimates based on your actual results. Think of this tool as a guide that helps you improve your financial management over time.
Modern digital tools make it easier to create and track your financial forecasts. Accounting automation and real-time data analysis give you more accurate information to run your business effectively.
Key points:
- The right format for you: Choose a model that matches your company’s size
- Data accuracy: Base your forecasts on real, reliable figures
- Constant adaptation: Update your forecasts based on your performance
- Modern tools: Use digital solutions to optimize your analyses
Looking to simplify your accounting management? Bizyness offers solutions tailored to sole traders and SMEs. Manage your invoices, your VAT, and your transactions with ease. With free and premium plans, Bizyness adapts to your needs so you can focus on growing your business.
