

 Français
How to calculate your business break-even point without getting it wrong
Learn how to calculate the break-even point with concrete examples and practical tips. The guide to mastering your financial performance.
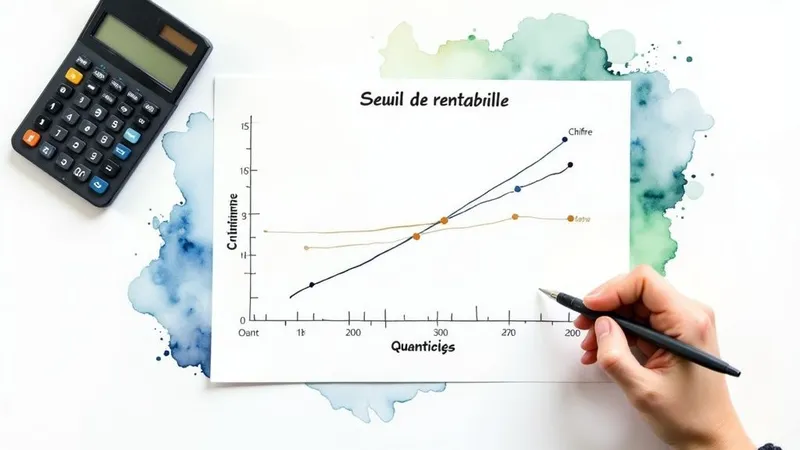
Simply put, calculating the break-even point means finding the exact revenue your business needs to generate to cover all of its costs. It’s your break-even threshold, your financial equilibrium. Below it, you’re in the red; above it, every new sale starts generating profit.
The break-even point, entrepreneurs’ number-one ally

Far more than accountant jargon, the break-even point is a real GPS for any entrepreneur, whether a freelancer or the head of an SME. It concretely answers a question that’s often a source of anxiety: “When will my business finally be profitable?” By calculating it, you turn that uncertainty into a clear, measurable, numeric goal.
Concretely, knowing this magic number lets you:
- Set sales targets that make sense for you and your teams.
- Check the viability of a project or a new product launch before pouring in your time and money.
- Make decisions with more confidence, whether adjusting your pricing or approving a major new expense.
A management tool above all
Too many entrepreneurs still see the break-even point as a chore, a figure to slip into a business plan just to please the bank. That’s a mistake. Its real power is giving you a clear view of the minimum performance your business model needs to hold up.
Imagine you’re launching an online store. Your break-even point will tell you exactly how many products you need to sell each month to cover your platform subscription, your ads, your stock, and your shipping costs. That target then becomes your obsession, your top priority.
For a business owner, the break-even point isn’t a finish line — it’s a fundamental landmark. It’s the figure that marks the border between survival and growth. Mastering it means taking back control of your financial trajectory.
The basic concepts to master
Before diving into the formulas, you absolutely need to be clear on a few key terms. This clarity is the sine qua non for an accurate calculation and, above all, for a smart interpretation of the results.
To make things easier, here’s a quick summary of the essential concepts to keep in mind.
The key components of the break-even point
A summary of the essential terms for understanding the break-even calculation and their practical meaning for an entrepreneur.
| Key Concept | Simple Definition | Concrete Example |
|---|---|---|
| Fixed Costs | The costs that hit every month, whether you sell a lot, a little, or nothing at all. | Your office rent, salaries, your invoicing software subscription. |
| Variable Costs | The costs directly tied to making or selling your product/service. The more you sell, the higher they climb. | Buying raw materials, delivery fees for an e-commerce business, commissions paid to a salesperson. |
| Revenue | The total amount of your sales (always excluding tax) over a given period. | The sum of all the invoices you issued and collected on over the month or year. |
| Contribution Margin | What’s left in your pocket on each sale after paying the costs directly tied to that sale. | You sell an item for €100. Making and shipping it costs €40. Your contribution margin is €60. |
Understanding the difference between fixed and variable costs clearly is the first crucial step. It’s this distinction that lets us calculate the margin needed to reach equilibrium.
Sorting your fixed costs from your variable costs
Even before tackling a single formula, the reliability of your calculation rests on one thing: your ability to properly classify your expenses. It’s the least exciting step, I’ll grant you, but it’s without question the most crucial. One small mistake here, and your entire break-even calculation will be skewed, potentially pushing you toward the wrong decisions.
On paper, the principle looks simple. On one side, costs that don’t budge an inch. On the other, those that move in step with your sales. Except in real life, the line is often blurrier than you’d think.
Identifying fixed costs
Fixed costs, also called structural costs, are all the costs you have to pay whether you make €1,000 or €100,000 in revenue. Think of them as your business’s foundation, the unavoidable expenses that exist just to keep the doors open.
It’s a bit like your Netflix subscription: whether you watch a single movie or an entire series in one weekend, the monthly price stays the same.
For your business, the most telling examples are:
- Rent for your offices or warehouse.
- Administrative staff salaries (those not directly tied to production).
- Software subscriptions (accounting, CRM, design, etc.).
- Your business insurance.
- Your accountant’s fees.
- Depreciation of your equipment.
These costs are generally predictable and stable, making them a solid base for any financial analysis.
Spotting variable costs
At the exact opposite end, you find variable costs. These are directly tied to your activity volume. The more you sell, the higher they climb. And if, unfortunately, you sell nothing, in theory they drop to zero.
Picture a craftsperson making jewelry: the cost of silver and stones is a variable cost. If they don’t make any jewelry, they don’t buy raw materials. It’s that simple. For an online seller, the cost of buying the products they resell is the perfect example.
Here’s a short list to help you see things more clearly:
- Purchases of raw materials or goods.
- Delivery and packaging fees for each order shipped.
- Commissions paid to your salespeople.
- Transaction fees charged by your payment platform (Stripe, PayPal…).
- Certain advertising budgets, such as cost-per-click (CPC) campaigns.
Getting a handle on these costs is vital, since they eat directly into your margin on every sale. If you want to dig deeper into the topic, our guide on calculating variable cost is made for you.
The headache of semi-variable costs
This is often where things get tricky. Some expenses are neither entirely fixed nor entirely variable. They have a bit of both. These are called semi-variable (or mixed) costs, and failing to identify them is a classic mistake that can completely throw off your calculations.
A semi-variable cost is one that includes a fixed base amount plus an extra portion that moves with activity volume. Ignoring it is like trying to measure the height of a tide without knowing the sea level at low tide.
Nothing beats concrete examples to untangle all this.
Scenario 1: A salesperson’s pay Your salesperson earns a fixed salary of €1,800 per month, plus a 5% commission on their sales.
- Fixed portion: €1,800
- Variable portion: 5% of revenue
For your calculation, you absolutely must separate the two. The base salary goes into “fixed costs,” while the total commission amount goes into “variable costs.”
Scenario 2: Your electricity bill If you run a production workshop, your electricity bill is a textbook case. It will almost always include:
- Fixed portion: The service subscription, which stays constant every month.
- Variable portion: Your actual consumption, which will spike when the machines run at full capacity to meet an order surge.
The method here is to comb through your bills over several months to isolate the subscription amount and estimate the share of consumption directly tied to production.
How to break down your costs in practice
To make sure you don’t miss anything, the simplest approach is to pull out last year’s income statement. Take each expense line, one by one, and ask yourself this simple question: “If my revenue had doubled, would this expense have increased?”
- If the answer is no, it’s a fixed cost.
- If the answer is yes, and proportionally so, it’s a variable cost.
- If the answer is “yes, but not quite proportionally,” it’s likely a semi-variable cost that needs to be broken down.
The best approach is still to build a simple table in a spreadsheet. List all your annual costs in one column, then create two columns: “Fixed Amount” and “Variable Amount.” This preparation, tedious as it is, is the real secret to calculating a break-even point that’s both reliable and genuinely useful for steering your business.
No accounting degree required to master the formulas
Have you sorted your fixed costs from your variable costs? Well done, the bulk of the work is behind you. Now, let’s let the numbers speak to find that vital figure your business needs to hit. And don’t worry, you don’t need an advanced accounting degree. The formulas are logical, and once you have them in hand, they’ll become real day-to-day management tools.
The idea is to find two things: the minimum revenue to generate (the break-even point in value) and how many products or services you need to sell to get there (the break-even point in volume).
Calculating the break-even point in value (revenue)
This is the most classic formula, the one that gives you an overall view. It tells you the precise amount, in euros, you need to invoice so that your sales cover all your costs, fixed and variable alike. At this revenue level, your net result is zero: no loss, no profit.
To understand this formula, you first need to grasp a key concept: the contribution margin. This is the real engine of your profitability. Simply put, it’s what’s left in your pocket on each sale once you’ve paid the costs directly tied to that sale. It’s with this margin that you’ll then “pay back” your fixed costs.
The formula is therefore:
Break-even point (€) = Fixed Costs / Contribution Margin Rate
And how do you find this famous Contribution Margin Rate? Like this:
(Revenue - Variable Costs) / Revenue
This rate, expressed as a percentage, shows you what share of your revenue is actually available to cover your overhead. Once those costs are covered, everything else is profit. If you want to dig deeper into margins, our guide to calculating margin is made for you.
A concrete example to make it clearer
Let’s imagine “Chloé’s Workshop,” a small online store selling handcrafted scented candles. After going through her books, Chloé listed her costs for the year:
- Annual Fixed Costs: €15,000 (workshop rent, software subscriptions, insurance, etc.)
- Annual Variable Costs: €20,000 (wax, fragrances, wicks, packaging, transaction fees…)
- Annual Revenue: €50,000
Let’s start by calculating her Contribution Margin Rate.
- First, the Contribution Margin: €50,000 (Revenue) - €20,000 (Variable Costs) = €30,000
- Then, the Contribution Margin Rate: €30,000 / €50,000 = 0.60, or 60%.
In practice, that means on every €100 sale, Chloé keeps €60 to pay her fixed costs and, after that, generate a profit.
Now let’s apply the break-even formula:
- Break-even point: €15,000 (Fixed Costs) / 0.60 = €25,000
The verdict is in: Chloé needs to invoice at least €25,000 to reach her break-even point. Every euro collected beyond that will be pure net profit.
Calculating the break-even point in volume (number of units to sell)
This second method is very telling, especially if you sell a product or service with a set price. It turns the break-even point into a very concrete target: “How many items do I need to sell?” It’s often far more motivating for a sales team.
The formula is just as straightforward:
Break-even point (units) = Fixed Costs / Contribution Margin per unit
Let’s stick with Chloé and her candles. Say her flagship model sells for €25 excluding tax.
- Unit selling price: €25
- Unit variable cost: Chloé knows that her €20,000 in annual variable costs correspond to producing 2,000 candles (since €50,000 in revenue / €25 per unit = 2,000 units). The variable cost per candle is therefore €20,000 / 2,000 = €10.
Let’s calculate the margin she earns on each candle:
- Unit contribution margin: €25 (selling price) - €10 (variable cost) = €15
Each candle sold therefore brings her €15 to help cover her fixed costs.
All that’s left is the final calculation for volume:
- Break-even point (units): €15,000 (Fixed Costs) / €15 (unit contribution margin) = 1,000 units
The figure is clear: Chloé needs to sell 1,000 candles over the year to cover her costs. It’s from candle number 1,001 that her business truly starts to be profitable.
To take another example, a typical French restaurant often reaches its break-even point around the middle of the year. For revenue of €100,000, with €40,000 in variable costs and €35,000 in fixed costs, its break-even point sits at €58,333, which, on average, corresponds to July 28th.
This simple diagram sums up the process of sorting expenses well, an essential step before diving into the calculations.
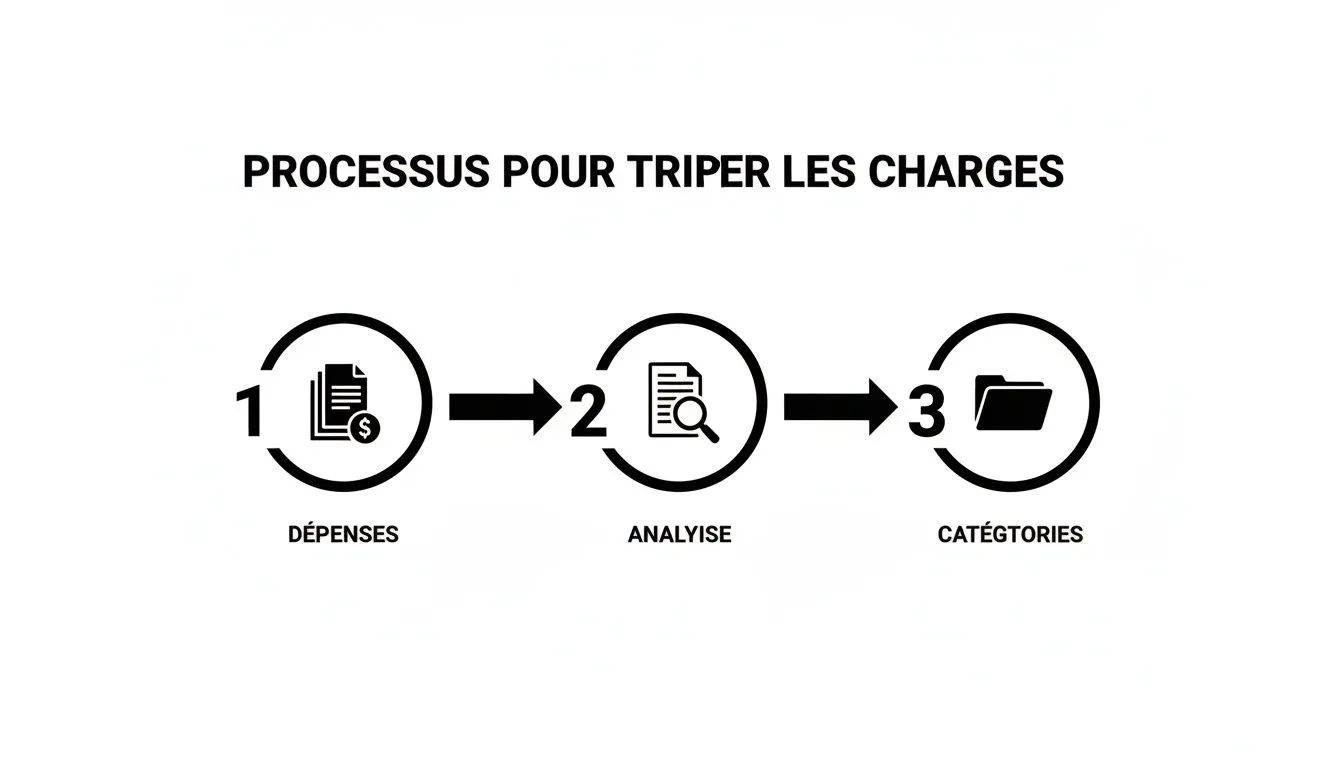
The more rigorous you are in this sorting phase, the more precise and reliable your break-even point will be. Of course, the break-even point is just one indicator among others. To make informed investment decisions, it’s also very useful to master the ROI calculation formula.
Managing the break-even point when you sell multiple products

Most businesses don’t bet everything on a single product. The reality on the ground is often far more complex: a varied catalog, multiple services, with margins that can swing wildly from one to another. In this context, calculating the break-even point can quickly turn into a headache.
Yet it’s essential to get an accurate view of your overall performance. The classic mistake would be to blindly apply the basic formula, which would give you a completely skewed result. The key is to account for the weight of each product in your revenue. This is known as the weighted contribution margin rate method.
The weighted contribution margin rate method
The principle is actually fairly simple. Instead of using a single, somewhat simplistic margin rate for the whole business, you calculate an average margin rate. This will intelligently reflect the importance of each product in your sales. It’s this average rate that you’ll then plug into the classic break-even formula.
With this approach, your break-even point becomes directly tied to your product mix, meaning how your sales are split across your various items.
Nothing clarifies things like a concrete example.
Example with an online store
Let’s take the case of the store “Le Coin du Geek.” It mainly sells two types of products:
- T-shirts (Product A): They fly off the shelves, but the margin is fairly thin.
- Collector figurines (Product B): Sales are more occasional, but the margin is much more comfortable.
The store’s annual fixed costs (site hosting, salaries, marketing, etc.) come to €20,000.
Here’s an overview of last year’s figures:
| Product | Revenue | Share of Revenue | Variable Costs | Contribution Margin | Contribution Margin Rate |
|---|---|---|---|---|---|
| T-shirts (A) | €60,000 | 60% | €42,000 | €18,000 | 30% |
| Figurines (B) | €40,000 | 40% | €16,000 | €24,000 | 60% |
| Total | €100,000 | 100% | €58,000 | €42,000 | 42% |
To get the weighted margin rate, you simply multiply each product’s margin rate by its share of revenue, then add up the results. This step gives us an accurate picture of the profitability of the whole business.
Let’s apply this logic to our store:
- T-shirt weighting: 30% (Product A margin rate) x 60% (share of revenue) = 18%
- Figurine weighting: 60% (Product B margin rate) x 40% (share of revenue) = 24%
The weighted Contribution Margin Rate is therefore: 18% + 24% = 42%.
We now have everything we need to calculate the overall break-even point:
- Break-even point (€) = Fixed Costs / Weighted Contribution Margin Rate
- Break-even point (€) = €20,000 / 0.42 = €47,619
Conclusion: “Le Coin du Geek” needs to generate total revenue of €47,619 to start turning a profit.
The strategic impact of your product mix
This calculation highlights a crucial point: your break-even point is never set in stone. It constantly shifts depending on which products you sell the most.
- If the store sells more figurines (a high-margin product), its weighted margin rate will climb, and its overall break-even point will drop. It will reach equilibrium faster.
- Conversely, if t-shirt sales (a low-margin product) take off, the weighted rate will fall, mechanically raising the break-even point. It will need to sell much more to cover its costs.
This analysis is a real goldmine for steering your sales and marketing strategy. It can push you to highlight your “star” products to optimize your business’s overall performance.
For rigorous tracking of this data, relying on a solid income statement template is more than recommended. This accounting document will give you the reliable figures needed for all these calculations.
Turn your break-even point into a management tool
Calculating your break-even point is good. Using it is better! This figure should never end up forgotten at the bottom of a spreadsheet. Its true value shows up when you turn it into a real dashboard for running your business day to day.
The idea is to move from a simple accounting metric to a strategic lever. Your break-even point should become a practical guide that answers very concrete questions: how many new customers do I need to find this month? What sales target should I set for my team next week? Can I afford to hire? That’s when it truly comes to life.
Make your sales targets concrete
An annual break-even point of €50,000 can seem impressive, even a bit abstract. To make it concrete and motivating, you need to break it down into smaller, more digestible, more immediate targets.
Here’s how you can break it down:
- Monthly target: €50,000 / 12 months = €4,167 in revenue to hit each month.
- Weekly target: €4,167 / 4.33 weeks = roughly €962 in revenue to generate each week.
Now, if you sell a product at €50, the calculation becomes even more telling. You need to sell 84 units a month, or about twenty a week. Suddenly, the target is far more tangible and easy to track. For a sales team, it’s a clear, measurable target — much more motivating than one big annual figure.
To track all this effectively, integrating custom CRM and ERP solutions quickly becomes essential. They let you centralize and analyze your data in real time, turning your break-even point into a true management tool.
Assess your leeway with the margin of safety
Your break-even point is your equilibrium point. But what happens if business slows down? How much of a hit can you absorb? That’s where another key indicator comes in: the margin of safety.
It simply represents the drop in revenue your business can withstand before it starts losing money. It’s your safety cushion, your buffer zone.
Margin of safety (€) = Current revenue - Break-even point
Let’s say your current revenue is €70,000 and your break-even point is €50,000. Your margin of safety is €20,000. In practice, that means you can afford to lose up to €20,000 in sales before slipping into the red. It’s an excellent way to gauge the resilience of your business model.
Use the break-even point to simulate your decisions
The real magic happens when you start playing with the numbers. Your calculation becomes a powerful simulator. Before every major decision, you can measure its direct impact on your profitability.
Scenario 1: My rent is going up — what happens? Your rent increases by €300 per month, or €3,600 more per year. Your fixed costs therefore rise from €15,000 to €18,600.
- New break-even point: €18,600 / 0.60 (your contribution margin rate) = €31,000.
- The impact? You’ll need to generate €6,000 in additional revenue just to offset this increase.
Scenario 2: Should I accept this contract with a lower margin? A major client offers you a contract that could boost your revenue by €10,000, but with a contribution margin rate of only 40% instead of your usual 60%. Should you accept?
- Contract contribution: €10,000 x 40% = €4,000.
- Analysis: This contract will contribute €4,000 toward covering your fixed costs. If your costs are already covered by your other activities, that €4,000 becomes pure profit. Even at a reduced margin, the opportunity can be very worthwhile.
With this proactive approach, you’re no longer at the mercy of events — you anticipate them.
Regularly tracking this indicator is a real driver of long-term sustainability. Take the general masonry sector in France: a business with €120,000 in annual fixed costs and an average contribution rate of 55% needs to generate at least €218,000 in revenue to break even. Industry analyses show that businesses monitoring this indicator every month have a 5-year survival rate of 68%, compared to just 52% for the others.
By building these habits into your management, the break-even point stops being a mere administrative formality. It becomes the beating heart of your financial strategy.
Frequently asked questions about the break-even point
Even with the formulas in hand, certain questions keep coming up. That’s normal! Let’s go through the most common questions so the break-even point no longer holds any secrets for you.
What’s the difference between the break-even point and the break-even date?
We tend to mix the two up, and yet they don’t measure the same thing. It’s an important nuance.
The break-even point is your target in terms of revenue or sales. It answers the question: “How much do I need to sell (in euros or in quantity) to cover all my costs?”
The break-even date, on the other hand, is a matter of time. It answers the question: “From when does my business start making money?” It’s often expressed as a number of days.
In short, one is a target, the other is a date on the calendar.
Imagine the break-even point is the finish line of a race. The break-even date is the stopwatch telling you exactly when you crossed that line.
Should VAT be included in the calculations?
The answer is simple and clear-cut: no. All your calculations must always be done on a tax-excluded basis.
Why? Because VAT doesn’t belong to you. You’re simply acting as a collector on behalf of the government. Including it in your calculations would artificially inflate your revenue and your costs, completely distorting the result. Your actual performance would be hidden.
How often should you recalculate your break-even point?
Doing the calculation once a year at year-end closing is the bare minimum. But let’s be honest, that’s not enough to truly steer your business. For proactive management, aim for a quarterly, or even monthly, update.
Your business isn’t static. Your costs and prices evolve. An update is needed as soon as a significant event occurs:
- A new employee joining (higher fixed costs).
- A negotiation with a supplier (lower variable costs).
- The launch of a new offering (change in average selling price).
This responsiveness gives you a clear view of the situation and lets you adjust course much faster.
To stop juggling numbers and get a clear view of your costs and revenue, a tool like Bizyness centralizes everything for you. It gives you reliable, up-to-date data to calculate your break-even point in the blink of an eye and steer your business with peace of mind.
