

 Français
 How to Read a Balance Sheet for Beginners
Discover how to read a balance sheet easily. Our practical guide simplifies financial analysis for beginners and entrepreneurs.

Breaking down a balance sheet can seem intimidating at first, but the basic principle is quite simple. Think of it as a snapshot of your company’s assets at a specific point in time. To read it well, you just need to remember one golden rule: what the company owns (assets) must always equal what it owes (liabilities). This is the famous balance sheet equilibrium.
Demystifying the balance sheet for good

The balance sheet isn’t just an administrative obligation to file once a year. It’s a real dashboard — a tool that, used well, helps you take the pulse of your business and answer crucial questions, even without being a seasoned accountant.
To simplify, imagine your company as a house. The assets are the house itself, with the furniture inside and the car in the garage. The liabilities, on the other hand, explain how all of this was financed: partly with your own contribution (equity) and partly with a bank loan (debt). In the end, the value of your property (assets) is necessarily equal to the sum of your financing sources (liabilities).
Grasping this logic is already a big step toward knowing how to read a balance sheet. This document gives you valuable information on:
- The structure of your assets: What have you invested in? Machinery? Premises? A business goodwill?
- Your debt level: Are your debts to banks or suppliers weighing too heavily in the balance?
- Your financial strength: Do you have enough equity to absorb a setback or to invest?
A well-interpreted balance sheet is your best ally for making informed decisions. It’s not just about reading numbers lined up on a page, but understanding the story they tell about the health and strategy of your company.
A reading that evolves
The balance sheet isn’t set in stone; it adapts to stay relevant amid new economic realities. In fact, an important reform is on the horizon.
The 2025 General Chart of Accounts (PCG) will modernize the presentation of financial statements for all financial years opened after December 31, 2024. The goal is to simplify how the balance sheet is read. It’s worth learning about the details of this balance sheet reform to anticipate these changes.
Knowing how to read this document gives you a huge advantage. You’ll be able to discuss things on equal footing with your banker, present a solid case to investors, and above all, steer your business with a clear, objective view of its situation.
Decoding assets: what the company really owns

When looking at a balance sheet, we often tend to see the assets column as a simple shopping list, an inventory of what a company owns. In reality, it’s much more than that. Assets are a direct reflection of strategy, past investments, and above all, the company’s true value-creation engine. To really know how to analyze a balance sheet, you need to start by dissecting this section. This is where you understand what makes the machine run day to day.
Assets are split into two major groups, and their balance says a lot about the business model. Take a manufacturing plant and compare it to a consulting firm. Their balance sheets will have nothing in common! One will be dominated by machinery and warehouses, the other by far less tangible values.
Fixed assets: the long-term engine
Here we find everything the company has bought to use over the long term, meaning for more than a year. Think of it as the foundations on which the entire business rests. It’s a key line item that reveals management’s long-term vision.
These investments fall into three categories:
- Tangible fixed assets: Everything you can touch. Land, buildings, machine tools, the vehicle fleet, or even office furniture. For an industrial company, this is often the heaviest line on the balance sheet.
- Intangible fixed assets: Although immaterial, their value can be immense. Here we’re talking about patents, software licenses, business goodwill, or brand value. A tech company, for example, will have fixed assets made up mainly of these elements.
- Financial fixed assets: These are simply long-term investments, such as equity stakes in other companies or loans granted to subsidiaries to support their growth.
Analyzing this section means judging the investment strategy. A company that constantly renews its equipment shows an ambition to innovate. Conversely, an aging fleet of machinery can be a sign of dangerous underinvestment.
Heavy fixed assets can signal a strong barrier to entry in an industry, but also a significant financing need and higher risk if the market turns. This is what’s known as a “capital-intensive” business.
Current assets: the fuel of everyday operations
Unlike fixed assets, current assets group together everything intended to quickly turn into cash, typically within less than a year. They represent the operating cycle, the blood flowing through the company’s veins.
Their main components are fairly intuitive:
- Inventory: This includes raw materials, work in progress, or goods awaiting sale. Watch out: excessive inventory is often a trap — it’s cash sitting idle, earning nothing.
- Accounts receivable: Simply put, this is the money customers still owe the company. Receivables growing from one balance sheet to the next? That’s a warning sign: the company may be struggling to get paid on time.
- Cash: This is money available immediately, in bank accounts or on hand. It’s the lifeblood that lets you pay salaries at month-end and suppliers without worry.
Well-managed current assets are an excellent sign of good operational health. They prove the company controls its cycle: it efficiently turns inventory into sales, and sales into cash.
Analyzing liabilities: where does the money come from?

If assets show us what the company owns, liabilities tell a different story: how is all of this financed? It’s the other side of the coin, and it’s just as fundamental. Diving into this part of the balance sheet lets you assess a company’s true financial strength and its dependence on creditors.
To understand it well, think of liabilities as made up of two major sources of financing: money that comes from inside (equity) and money that comes from outside (debt). Grasping this balance is key to reading a balance sheet like an expert.
Equity, the company’s true wealth
At the heart of liabilities, we find equity. It represents what truly belongs to the company and its shareholders. It’s the result of two things: money put on the table at startup (share capital) and, above all, profits that have been patiently reinvested in the business over the years.
Think of it as the company’s safety cushion. The thicker this cushion, the more autonomous the company is and the better able to absorb shocks.
Specifically, equity includes:
- Share capital: The initial stake, the founders’ original contributions.
- Reserves: Profits from previous years that weren’t distributed as dividends but kept to finance growth or weather a hard time.
- Net income for the period: The profit (or loss) for the year just ended. If positive, it strengthens equity. If negative, it erodes it.
A high level of equity is an extremely positive signal for bankers and investors. It proves the company generates its own wealth and doesn’t rely solely on borrowing to grow.
Debt, the external fuel for growth
The other major part of liabilities is debt. It encompasses all of the company’s financial obligations to third parties. Debt shouldn’t be demonized; it’s often an essential growth lever. The real question is whether its level and nature are well managed and suited to the business.
Debt is generally classified by time horizon:
- Long-term financial debt: Mainly bank loans taken out for large investments (buying machinery, building a warehouse, etc.). Repayment is spread over several years.
- Short-term operating debt: These are directly tied to the daily operating cycle. This includes accounts payable (invoices you still need to pay), payroll liabilities (contributions owed to social agencies), and tax liabilities (VAT, corporate tax, etc.).
The table below breaks down the key elements of liabilities to clarify their origin and nature.
Detailed structure of liabilities
| Liability category | Main components | What it represents for the company |
|---|---|---|
| Equity | Share capital, reserves, net income for the period | Internal resources, the financial safety net. |
| Long-term debt | Bank loans, bonds | Financing of strategic investments. |
| Short-term debt | Accounts payable, tax and payroll liabilities, bank overdrafts | Obligations tied to day-to-day operations. |
This breakdown helps clearly see the financing structure and identify potential risk areas.
Analyzing liabilities is all the more crucial for French companies in a tense economic context. In 2025, the increase in mandatory levies is expected to reach 21 billion euros, nearly two-thirds of which will fall on businesses. This tax pressure directly impacts their cash flow and tends to mechanically inflate tax liabilities on the balance sheet. To learn more, you can consult Rexecode’s detailed analysis of the trend in mandatory levies.
One point of absolute vigilance? A glaring imbalance between short- and long-term debt. If a company finances durable investments with resources payable at any time (like supplier credit), it puts itself at risk. A simple supplier asking to be paid faster than expected can trigger a liquidity crisis. This is the classic trap that can drive a company — profitable on paper — to insolvency.
Calculating the financial ratios that really matter
Analyzing assets and liabilities separately is good. It’s the essential starting point. But to truly read a balance sheet and feel the company’s pulse, you need to make the numbers talk to each other. That’s where financial ratios come in. They’re much more than simple calculations; they’re translators that turn raw data into clear, actionable insights.
Rather than drowning you in an avalanche of complex formulas, let’s focus on three fundamental ratios. Together, they’ll give you a remarkably precise view of the company’s financial balance, operational needs, and independence.
Net working capital (NWC): the safety cushion
NWC is the first stability indicator to look at. It answers a simple but vital question: are my stable financial resources (long-term) sufficient to finance my investments (my fixed assets)?
The formula is straightforward:NWC = Permanent capital - Fixed assets
As a reminder, permanent capital includes your equity and your long-term debt. It’s the money intended to stay durably in the company.
- Positive NWC? Excellent news. It means your stable resources fully finance your investments, with a surplus left over. This surplus acts as a safety cushion to fund part of your ongoing needs.
- Negative NWC? Watch out, this is a warning sign. The company is financing its long-term investments with short-term resources (like a bank overdraft, for example). This is a structural imbalance that can become very dangerous.
Working capital requirement (WCR): the pulse of operations
WCR is the thermometer of your day-to-day cash needs. It measures the financial timing gap inherent to your business: you have to pay suppliers and finance inventory well before collecting money from customers.
Here’s how it’s calculated:WCR = Current assets excluding cash - Current liabilities excluding cash
Or, more intuitively for an entrepreneur:WCR = (Inventory + Accounts receivable) - Accounts payable
A positive WCR means your operating cycle consumes cash. This is quite normal in many industries, but it needs to be watched closely. If your WCR balloons from one year to the next, it may be a sign of poor inventory management or that customers are taking longer and longer to pay you.
Having a negative WCR is rarer, but it’s a very comfortable position. It’s the model used by large retailers: they collect payment from customers upfront but pay suppliers in 30 or 60 days. In this case, the business generates cash instead of consuming it.
The infographic below illustrates this analytical process well, moving from the balance sheet’s major categories to key ratios like the debt ratio.
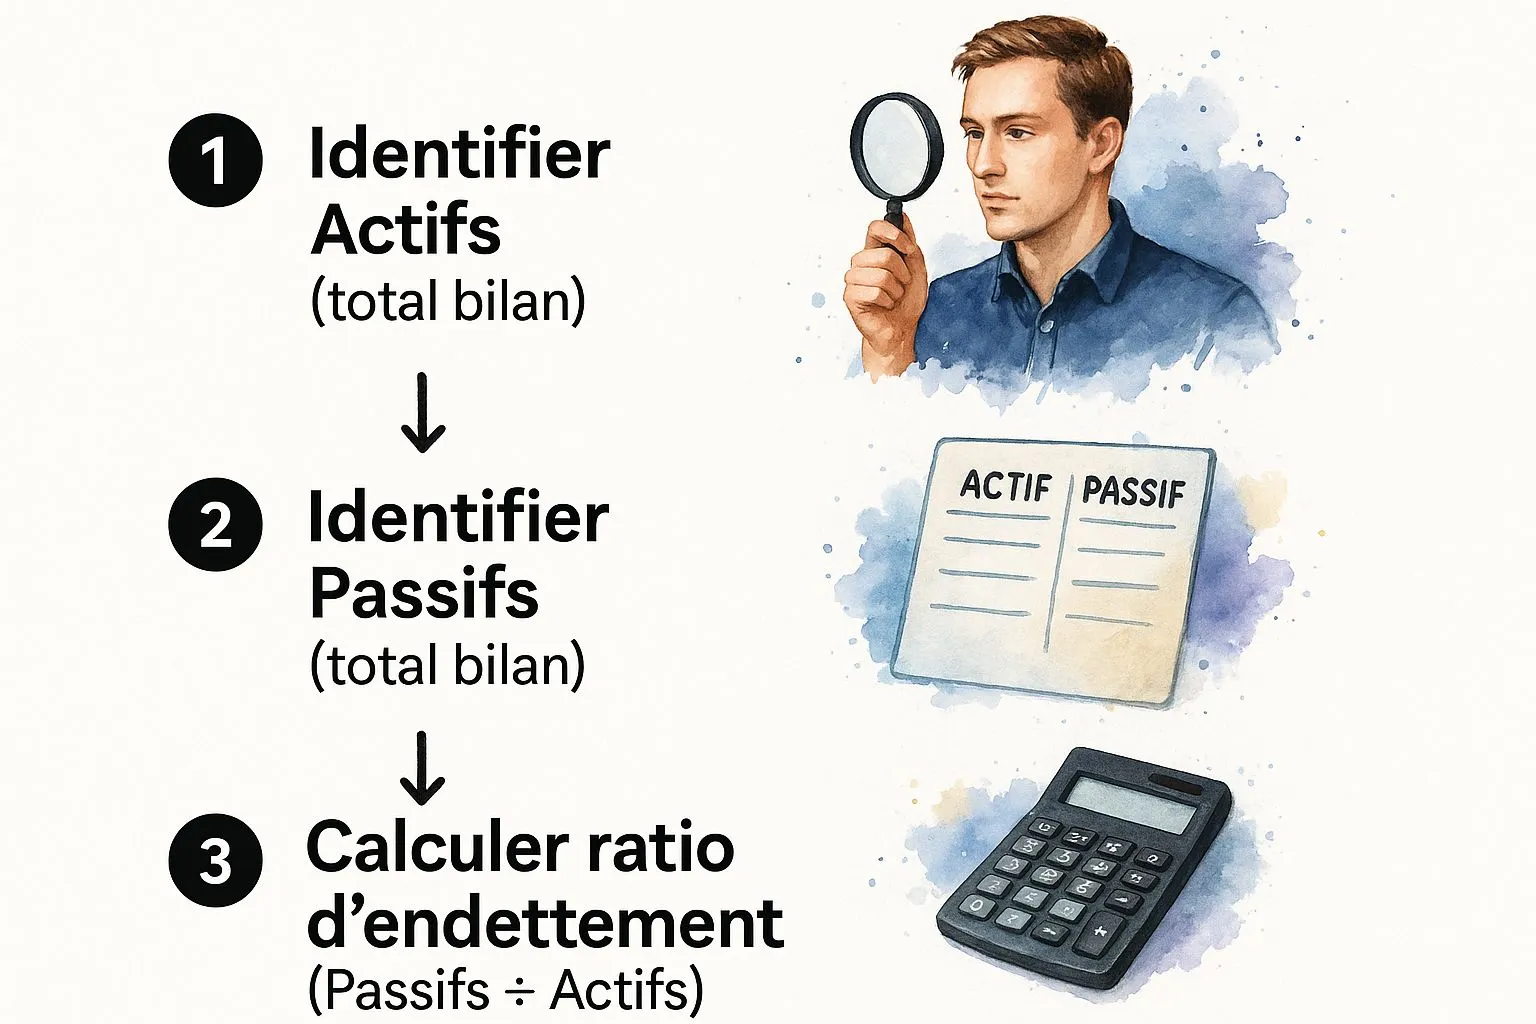
This visual shows that good financial analysis moves from the general (the balance sheet blocks) to the specific (summary indicators) in order to measure the company’s real health.
The financial independence ratio: the barometer of autonomy
This last ratio is absolutely crucial for assessing how dependent your company is on its creditors, particularly banks. It simply measures the weight of your equity relative to the total size of your balance sheet.
The formula is a piece of cake:Financial independence ratio = (Equity / Total balance sheet) x 100
A high result is a sign of strength and independence. Bankers love that.
| Ratio result | My interpretation |
|---|---|
| Above 40% | Excellent independence. Your company is seen as very solid and inspires confidence. |
| Between 20% and 40% | Adequate independence. This is generally considered an acceptable threshold by most financial partners. |
| Below 20% | High dependence. The company is heavily indebted, making it vulnerable to the slightest downturn. |
These three ratios — NWC, WCR, and financial independence — form a powerful trio. It’s their combined analysis that gives you a dynamic, complete picture. For example, strong NWC can fully offset a high WCR, helping maintain healthy cash flow. Good management of these balances is often the first step before digging into other indicators. In fact, to go further, you might want to learn how to calculate the break-even point to round out your analysis.
Connecting the balance sheet and the income statement
The balance sheet is a snapshot. It shows you your company’s financial position at a given moment. But to understand the year’s story, its actual dynamics and performance, you absolutely need to view it alongside its essential companion: the income statement.
These two financial documents are inseparable. Trying to analyze them separately is a bit like watching the final score of a match without seeing a single play. You have the result, but no idea how you got there.
The direct impact of net income on equity
The most obvious — and arguably most important — connection point is net income for the period. This figure, which concludes the income statement, simply represents the profit or loss generated by your business over the period.
And where does this result end up once the financial year closes? Directly into equity, on the liabilities side of the balance sheet.
- If you make a profit: Great! This newly created wealth boosts your equity.
- If you record a loss: That’s a warning. The value of your equity decreases, because the company consumed more resources than it generated.
This constant flow is what makes the balance sheet a living document, evolving from one year to the next. Net income is the bridge linking the year’s performance (the income statement) to accumulated wealth (the balance sheet). It translates into euros how the year’s successes or difficulties impacted the company’s value.
To fully master this architecture, it’s helpful to know how to prepare a balance sheet from A to Z, a process we cover in detail in our complete guide.
Consider this: a company can very well post a profit (positive income statement) yet see its equity stagnate or even decline. How? If it decides to distribute 100% of that profit as dividends to its shareholders instead of reinvesting it.
The trap scenario of too-rapid growth
Analyzing these two documents together helps uncover situations far more complex than they first appear. Take a classic case I’ve often seen: a young company whose sales are taking off.
At first glance, everything looks great. The income statement is euphoric: revenue is soaring, profit follows. You’d be tempted to pop the champagne. But a close look at the balance sheet can tell a very different story.
This explosive growth has caused the working capital requirement (WCR) to balloon. To keep up with the flood of orders, the company had to massively stock up on inventory. To win market share, it granted longer payment terms to new customers, driving receivables sharply upward.
The balance sheet then reveals that this business acceleration, however positive, has created a cash gap that profit alone cannot cover. The company is profitable but is financially suffocating, on the verge of insolvency.
This cross-analysis is therefore vital. It shows that great news on the income statement can hide a major risk on the balance sheet. Knowing how to read both documents together gives you a 3D view, far more nuanced and essential for steering your company’s true health without unpleasant surprises.
Frequently asked questions about reading a balance sheet
Facing a balance sheet for the first time can be intimidating. Lots of numbers, some technical terms… it’s normal to have questions. I’m here to answer them simply and help you see things more clearly.
What’s the big difference between a balance sheet and an income statement?
Think of it this way: the balance sheet is an instant snapshot of your company’s assets. On a specific date, say December 31, it tells you: “Here is everything the company owns (its assets) and here is everything it owes (its liabilities).” It’s a status report at a given moment.
The income statement, on the other hand, is more like the year’s movie. It tells the whole story of the business: sales, purchases, various expenses — everything that happened between January 1 and December 31. At the end of the movie, you discover the result: profit or loss. This final result is then added to equity in the snapshot, meaning the balance sheet.
Why are assets always equal to liabilities?
This is THE golden rule of accounting, the famous double-entry principle. The idea is simple: every financial resource entering the company (recorded as a liability) must necessarily be used somewhere (and therefore recorded as an asset). There’s no magic money.
Imagine your company takes out a loan of €10,000. This amount is a new debt, so it’s recorded as a liability. But this money doesn’t disappear — it lands in the company’s bank account. This €10,000 is therefore also recorded as an asset, in cash. The balance is perfect; it’s purely mathematical.
What does negative equity mean?
This is probably the most alarming red flag you can see on a balance sheet. Negative equity means something very serious: the total amount of the company’s debts exceeds the value of everything it owns.
In other words, even by selling all its assets — machinery, inventory, offices — the company couldn’t repay all of its debts. This is a state of technical insolvency requiring urgent measures, such as a massive recapitalization or a deep restructuring.
Can I really analyze a balance sheet without being an accountant?
Absolutely. The goal isn’t to turn you into a chartered accountant, but to give you the keys to know how to read a balance sheet and extract the essentials.
By focusing on the major categories (working capital, working capital requirement, cash) and the few key ratios we’ve covered, you’re perfectly capable of:
- Judging a company’s financial soundness.
- Spotting warning signs, such as excessive debt or liquidity problems.
- Decoding its investment and financing strategy.
- Making more informed decisions for your own company.
It’s about understanding the big picture to steer your business with more clarity, not getting lost in technical details.
So you can focus on growing your business without worrying about accounting complexity, Bizyness automates your invoices, VAT, and financial reports. Save time and gain peace of mind with Bizyness today.
