

 Français
 Income Statement in Excel: Guide and Downloadable Templates
Learn how to build a clear, effective income statement in Excel: formulas, analysis, and downloadable templates to steer your business.

Far more than a simple table, your income statement is the true pulse of your business. Building it yourself in Excel means taking full control of your financial data. You move away from rigid formats to create a tailor-made tool, capable of simulating scenarios and generating visual dashboards that actually make sense for you.
Why Excel remains a powerful management tool
Even in the age of dedicated accounting software, Excel remains the top favorite of many small and micro businesses in France. And for good reason: its flexibility is unmatched. An accounting obligation turns into a genuine strategic management instrument, within reach of any entrepreneur who wants their numbers to speak and guide the right decisions.
By mastering your income statement in Excel, you give yourself the means to:
- Fully customize your reports: You can adapt the structure to your industry, add key performance indicators (KPIs) that are your own, and create charts that truly illustrate your performance.
- Simulate future scenarios: It’s child’s play to test the impact of a price increase, a new hire, or a drop in raw material costs on your profitability.
- Retain complete independence: Here, there’s no dependency on software updates or imposed formats. You are master of every cell, every formula, every chart.
Excel’s popularity in numbers
This approach is far from a niche practice. A recent study on accounting tools used in France confirms it: more than 75% of small businesses report using Excel as their primary tool for their annual accounts, including the income statement. This preference stems from its calculation power and its ability to fit the specific needs of every business, without having to invest huge sums.
Of course, this popularity also highlights a major challenge: the risk of errors. For effective management, rigor is non-negotiable, whether your business is local or you’re considering launching a business abroad.
Expert tip: For a reliable income statement in Excel, everything rests on a well-thought-out initial structure and iron discipline in data entry. Really take the time upfront to properly define your product and expense categories. It will save you a lot of headaches and tedious corrections later on.
Mastering these basics is the foundation of reliable numbers. To dig deeper into setting up your financial tracking, take a look at our complete guide to keeping your accounting in Excel effectively. It will help demystify the process, starting from the key concepts (revenue, expenses, net income) to equip you to build a management tool that is both robust and personal.
Building a reliable accounting structure in your spreadsheet
For an income statement in Excel to be more than just a list of numbers, it needs solid foundations. That foundation is a clear, logical structure that reflects the economic reality of your business. If the organization isn’t spot-on from the start, your calculations risk being skewed and your analyses, useless.
The idea is to create a table where every transaction naturally finds its place, without you having to rack your brain. The simplest and most effective way to get there is to draw on French accounting logic.
This hierarchical view gives you a good sense of the fundamental flow of an income statement: you start from revenue generated, deduct expenses incurred, and arrive at net income.
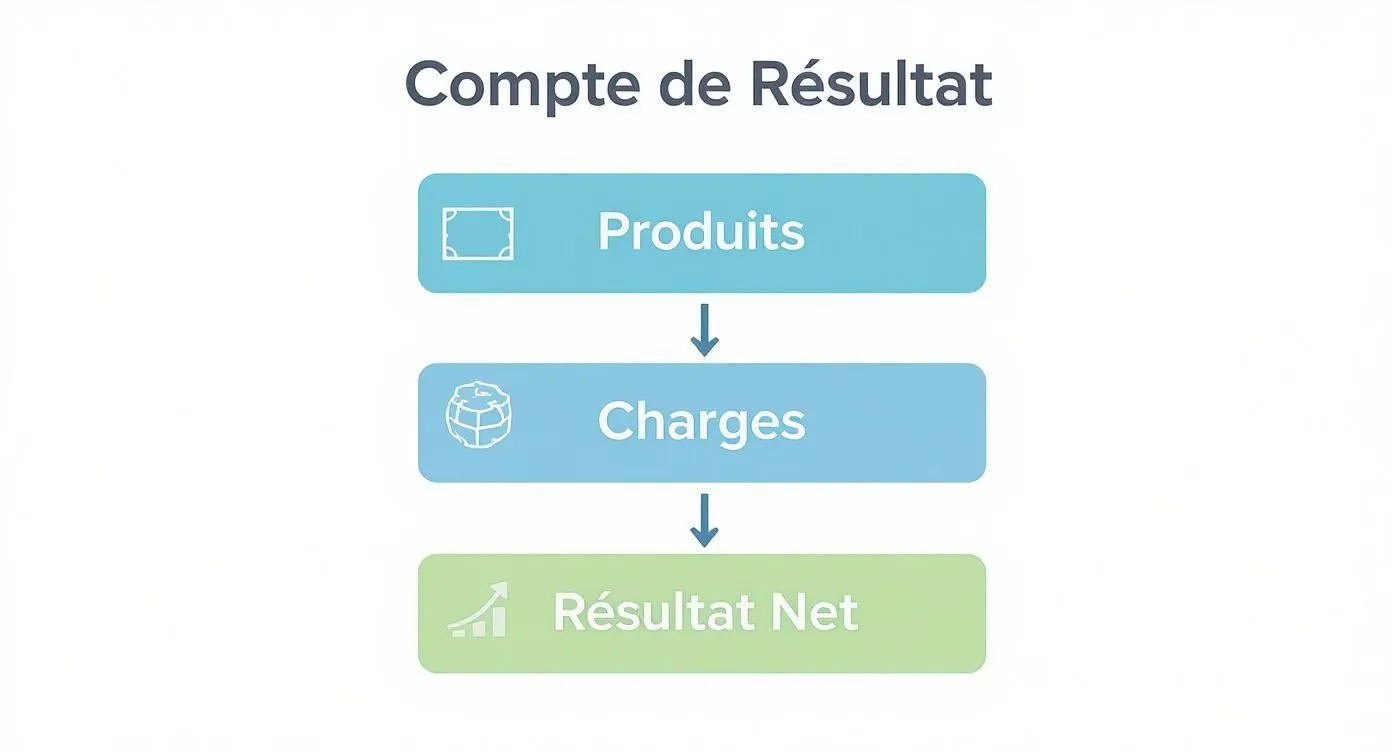
This diagram illustrates a simple truth well: a company’s performance is the result of the difference between what it earns and what it spends.
Distinguishing revenue from expenses
The very first step is to clearly separate the two major families of flows that drive your business: revenue and expenses. This is the very principle of the income statement.
- Revenue represents everything that enriches your business. It increases its value.
- Expenses, conversely, represent everything that depletes it. These are the costs needed to keep the business running.
This distinction may seem obvious, but rigor plays out in the details. For example, a reimbursement from your insurer after a claim is (extraordinary) income, while your annual insurance premium is a standard operating expense.
The key line items of your income statement
To go further, you now need to break these two broad categories down into more specific line items, aligning with accounting standards.
On the revenue side:
The main line item is unquestionably turnover (revenue). It corresponds to the total amount of your sales of goods or services. A good habit: split it out if you have several distinct business lines (for example, equipment sales vs. maintenance contracts).
On the expense side:
Here, the list is often much longer and deserves meticulous classification. Here are the most common categories for a small business:
- Purchases of goods or raw materials: The cost of what you buy to resell or transform.
- External expenses: This is a large, somewhat catch-all category that includes rent, electricity, professional fees (accountant, lawyer), insurance, shipping costs, or marketing spend.
- Personnel costs: This includes gross salaries and employer social contributions. It’s often one of the heaviest line items.
- Taxes and duties: Note that this doesn’t refer to corporate income tax (which is calculated after net income), but rather local business taxes (CFE, CVAE) or other taxes directly tied to your activity.
Rigorous classification isn’t just a formality. It’s what lets you calculate key indicators like gross margin or operating income, which give you a precise picture of your core business performance.
The table below summarizes this logic. It presents the major blocks of the income statement to quickly visualize its structure and the calculation of the various intermediate management balances.
| Category | Main line items | Operation |
|---|---|---|
| Operating income | Turnover (sales) | + |
| Operating expenses | Purchases, external expenses, personnel costs, taxes and duties | - |
| Operating income (result) | = Operating income - Operating expenses | = |
| Financial income | Interest on investments | + |
| Financial expenses | Interest on borrowings | - |
| Financial result | = Financial income - Financial expenses | = |
| Ordinary income before tax | = Operating result + Financial result | = |
| Extraordinary income | Asset disposals, tax relief | + |
| Extraordinary expenses | Fines, penalties | - |
| Extraordinary result | = Extraordinary income - Extraordinary expenses | = |
| Corporate income tax | Tax on profits | - |
| Net income | = Ordinary income before tax + Extraordinary result - Tax | = |
This structure, even simplified, gives you a solid working framework for analyzing what generates value and what costs you.
Following the French Chart of Accounts (PCG) framework
In France, the structure of the income statement isn’t left to chance. The French Chart of Accounts (Plan Comptable Général, or PCG) imposes fairly strict presentation rules for most businesses. This document, which complements the balance sheet and the notes, aims to give a true and fair view of performance. To learn more, discover how the French Chart of Accounts can structure your approach, even in a simple spreadsheet.
Adopting this structure in your Excel file is a mark of credibility, whether with your banker, potential investors, or the tax authorities. It guarantees sound financial analysis and effective communication. Your income statement in Excel then moves from a simple table of numbers to a genuine strategic management tool.
The Excel formulas that will automate your analysis
Having a clear structure is the foundation. But the real power of an income statement in Excel lies in making it smart. The idea isn’t to create a simple table where you store numbers, but a dynamic tool that works for you. It should calculate your results in real time and highlight what matters, without you having to reach for a calculator every time.
To get there, a few well-chosen formulas are enough. They turn what could be tedious data entry into a genuinely responsive dashboard.
The basics: the SUM function for totals
Let’s start with the simplest, but also the most essential: the SUM function. It’s the backbone of your income statement. It lets you add up all your revenue on one side and all your expenses on the other in the blink of an eye.
Imagine your various revenue sources (product sales, services, etc.) are listed in cells B2 to B10. The formula =SUM(B2:B10) in cell B11 will instantly give you your total turnover. The same logic applies to aggregating your expenses. This is the basis of everything, and it guarantees your totals are always accurate, even if you add or edit a line.
Automating sorting with SUMIF
This is where the magic really begins, especially when it comes to categorizing your expenses. You may have a tab where you list all your expenses as they occur, assigning each one a category (“Rent,” “Supplies,” “Marketing,” etc.). The SUMIF function is the perfect tool to automate this sorting.
In plain terms, it lets you tell Excel: “Look in this column for all the amounts that match the ‘Marketing’ category and add them up for me.”
The syntax is quite simple: =SUMIF(criteria_range; "criterion"; sum_range).
- criteria_range: the column where you’ve listed your expense categories.
- “criterion”: the name of the category you want to isolate (for example, “Rent”).
- sum_range: the column containing your expense amounts.
Thanks to this formula, your income statement updates itself automatically every time you add a new expense to your tracking. No more manual sorting and no more risk of forgetting an invoice!
A seasoned tip: To avoid typos that skew your calculations (“Marketing” vs. “marketing” or “Markting”), use Excel’s “Data Validation” feature. It lets you create a drop-down list for your categories. That guarantees you always use the same label, and therefore a
SUMIFfunction that works every time.
Making your formulas more human with named ranges
Formulas like =SUM(C2:C25) - SUM(C28:C50) quickly become a headache to read. To make your income statement in Excel clearer and easier to evolve, get into the habit of using named ranges.
This feature lets you give an easy-to-remember name to a cell or a range of cells. For example, the cell containing your total revenue can be named “Total_Revenue” and the one for expenses “Total_Expenses.”
It’s very simple to set up:
- Select the cell (or range of cells).
- Go to the “Formulas” tab, then click “Define Name.”
- Choose a meaningful name (preferably without spaces).
Your result calculation formula then becomes much more readable: =Total_Revenue - Total_Expenses. Not only is it more intuitive for you, but it also considerably reduces the risk of error if you need to reorganize your table later.
Making the numbers speak with conditional formatting
A number is good. But knowing at a glance whether it’s good or bad is better. Conditional formatting is a formidable visual tool for that. It changes a cell’s color based on the value it contains.
For example, for your net income cell, you can create a very simple rule:
- If the value is greater than 0, the cell background turns green.
- If the value is less than 0, the cell background turns red.
This small trick turns your table of numbers into a genuine health indicator. At a single glance, you know whether you’re in the black or in the red. This is especially useful for monthly tracking, where you can immediately spot profitable months and those that need your attention.
By combining these few functions, you’re not just building a table, but a genuine automated analysis tool. Your income statement becomes more reliable, faster to update, and, above all, much easier to understand.
How to interpret the numbers to make the right decisions
Having a well-built, automated income statement in Excel is an excellent first step. But the real magic happens when you know how to make these columns of numbers speak to make strategic decisions. Let’s be clear: a table, even a perfect one, is useless if it stays a mere compilation of data.
That’s where financial analysis comes in. No need to turn into a chartered accountant overnight. The idea is to understand what the key indicators say about the real health and performance of your business.
Going beyond net income
Net income, whether positive or negative, is a bit like the star of the show. It’s the number everyone looks at first. Yet it only tells the end of the story. To truly steer your business, you need to break down the path that leads to that result. That’s the role of intermediate management balances (soldes intermédiaires de gestion, or SIG).
Think of the SIG as checkpoints along the road to your profitability. They break down how the result is formed and give you very concrete avenues for action.
- Trade margin: (Sales of goods - Cost of goods sold). This is the first indicator to watch closely if you’re in buy-resell business. If this margin erodes, it may be that your purchase prices are rising faster than your selling prices. A clear signal that it’s time to renegotiate with your suppliers or revisit your pricing.
- Gross operating surplus (EBE, or EBITDA-like measure): Now here’s an indicator that gets straight to the point. It measures the raw performance of your core business, before the impact of your financing or investment choices. Basically, it’s the cash your business generates on its own. A positive, growing gross operating surplus is an excellent sign of vitality.
Analyzing these intermediate balances means moving from the passenger seat to the driver’s seat. You no longer just observe the final result — you understand how it’s built and, most importantly, where you can act to improve it.
Calculating ratios to benchmark yourself
Raw numbers are good. But ratios give them depth. They turn absolute amounts into performance indicators, letting you track your progress over time and compare yourself to others.
One of the most telling is the net profit margin ratio.
The formula is quite simple: (Net Income / Turnover) x 100.
This ratio tells you what percentage of your turnover actually turns into profit. For example, if you generate €150,000 in turnover for a net income of €15,000, your profit margin ratio is 10%. In other words, for every €100 collected, you keep €10 in your pocket once everything is paid.
Tracking this ratio’s trend is essential. A slight decline from one quarter to the next can reveal a quiet but ongoing increase in your expenses. It’s an early warning that lets you correct course before the situation worsens.
Knowing how to interpret these numbers is a skill that goes well beyond simple business management. It’s a logic that also applies to your personal finances, for example when assessing your borrowing capacity and bringing your projects to life.
Putting the numbers in perspective
Financial analysis is not an exact science; it’s all about context. The same income statement can be interpreted in a thousand ways depending on the size of the business, its industry, or even the broader economic climate. This logic applies at every scale, including that of a state.
Take the overall income statement of French public administrations. Official data reveal a contrasted picture: net revenue of the state’s general budget stands at around €308 billion, against net expenses of €445 billion. The result is a budget deficit of around €139 billion, weighed down by debt interest charges reaching €59 billion.
This macroeconomic context inevitably has an impact on businesses. In such an environment, mastering the analysis of your income statement in Excel becomes a strategic advantage, not only for steering your day-to-day operations, but also for communicating credibly with your financial partners, whether that’s your banker or potential investors.
Our ready-to-use income statement Excel templates
Starting from a blank sheet to create an income statement can quickly become a headache. To save you precious time, we’ve prepared several Excel templates that you can download and use right away.
Each template was designed for a specific situation. Whether you’re a freelancer under the micro-entrepreneur (sole trader) scheme or running an SME with more advanced analysis needs, you’ll find what you’re looking for. The idea is simple: we provide the structure, the formulas, and the layout. All you have to do is plug in your numbers.

A template for every situation
Let’s be clear: not all entrepreneurs have the same needs. A sole trader has no use for an ultra-complex table, while an SME often needs to follow precise accounting standards. That’s why we created several versions.
- The simple, straightforward template for independents: Perfect for freelancers and micro-businesses. It gets straight to the point, clearly separating revenue from expenses to calculate your profit at a glance. No frills.
- The detailed template (PCG-compliant): This one is designed for SMEs. It follows the logic of the French Chart of Accounts and includes intermediate management balances (margin, gross operating surplus…). It’s the ideal tool for serious financial analysis.
- The template with a visual dashboard: Do you like steering your business with clear charts? This template is for you. It includes a visual dashboard that updates automatically to track your key performance indicators.
To help you make the right choice, here’s a quick comparison.
Comparison of the proposed income statement templates
This table helps readers choose the Excel template best suited to their situation and level of financial reporting needs.
| Template type | Ideal for | Key features | Complexity level |
|---|---|---|---|
| Simplified | Sole traders, freelancers, micro-businesses | Direct income calculation, basic expense categories, ready to use | Low |
| Detailed (PCG) | SMEs, growing startups | PCG-compliant structure, intermediate balance calculations, operating/financial distinction | Medium |
| With dashboard | Data-driven managers, monthly tracking | Dynamic charts, KPI tracking, year-over-year comparison | High |
Each of these files is an excellent starting point that you can of course adapt. If you’re looking for other options, take a look at our article offering another income statement template to download.
How to customize your file
Once your template is downloaded, adapting it to your business is child’s play. Each file contains simple instructions to guide you.
You’ll start by entering your company name and the period you want to analyze. Then comes the one real task: listing your revenue and expenses in the tabs provided for that purpose. That’s where it all happens.
An expert tip: Discipline is key. Get into the habit of categorizing every expense or revenue item as soon as it comes in. It will save you from pulling your hair out at the end of the month trying to track everything down.
All the formulas are already in place and protected to prevent accidental changes. As soon as you add a figure, everything updates instantly. You see the impact of every transaction on your profitability in real time. It’s magic.
A few tips for reliable data
A good tool isn’t everything. For your income statement in Excel to be truly useful, the data has to be spotless. Here are a few habits to adopt to avoid unpleasant surprises.
- Centralize data entry: Dedicate one tab of your workbook to the raw entry of all your transactions, both incoming and outgoing. Your summary tables will pull information directly from there. Clean and efficient.
- Use data validation: To avoid typos (“Office supplies,” “Office suplies”…), use Excel’s “Data Validation” feature to create a drop-down list of your expense categories. This standardizes everything and prevents breaking your
SUMIFformulas. - Do a bank reconciliation: At least once a month, compare what you’ve entered in Excel with your bank statements. It’s the best way to make sure you haven’t forgotten anything and that all the amounts are correct.
With these good practices, your Excel file will become much more than a simple table of numbers. It will be a true ally for steering your business with confidence.
Your questions about the income statement in Excel
Even with the best tutorials, a few grey areas often remain when you get started. That’s perfectly normal! That’s why we’ve gathered here the questions that come up most often from entrepreneurs building their first income statement in Excel. The idea is to clear up any last doubts so you feel completely comfortable with your new tool.
Let’s go through these key points together.
Does an income statement made in Excel have legal value?
The answer is no. A simple Excel file, however well built, is not an official accounting document for the tax authorities. For most businesses (with the exception of micro-businesses under certain thresholds), the law requires proper bookkeeping that results in annual accounts, often certified by a chartered accountant.
But that doesn’t mean it’s useless — quite the opposite! Your income statement in Excel is a fantastic day-to-day management tool. It’s your personal dashboard for tracking performance, making quick decisions, and staying in control of your business.
What is the difference between a balance sheet and an income statement?
Ah, the classic question! People often confuse the two at first, but their roles are radically different.
- The balance sheet is a snapshot. It freezes your company’s situation at a precise moment in time (often December 31) and lists everything it owns (assets) and everything it owes (liabilities).
- The income statement is a movie. It traces the entire activity over a given period (a month, a quarter, a year), detailing what enriched the business (revenue) and what depleted it (expenses). It’s what explains how you generated a profit or a loss.
To put it simply: the balance sheet tells you what you have, while the income statement explains how you earned it (or lost it).
Should VAT be included in the income statement?
The golden rule is to always think in net of tax (excluding VAT) terms. Why? Because VAT isn’t yours. The VAT you charge your customers, you’re only collecting it on behalf of the state before passing it on. Conversely, the VAT you pay on your own purchases is generally deductible.
Including VAT would completely distort the reading of your performance. Your income statement should show the wealth actually created by your business, without these VAT flows that merely pass through your cash.
Tired of juggling spreadsheets? Switch to smooth, automated financial management. With Bizyness, you can create your invoices, track your finances, and prepare your tax filings effortlessly. Discover how to simplify your business management on Bizyness.fr.
