

 Français
Income Statement Table: A Complete Guide for Beginners
Learn everything about the income statement table. A practical guide to mastering this essential financial tool. Click to learn more!

Demystifying the income statement: your financial GPS

The income statement. This name may sound a bit intimidating at first, but it actually hides an essential tool for understanding the financial health of your business. Think of it as the GPS of your activity: it tells you where you stand, where you came from, and where you’re headed. This diagram illustrates the classic structure of the statement, with its income, its expenses, and the final result.
It’s not just a list of numbers — it’s a true narrative of your company’s performance over a given period, usually a year. Like a snapshot, it captures the essence of your activity and reveals its profitability. It highlights your strengths, your weaknesses, and lets you anticipate upcoming challenges.
Take the example of a baker. The money earned from selling pains au chocolat, baguettes and tarts represents their income. The cost of flour, sugar, shop rent and employee salaries make up their expenses. The difference between income and expenses determines their profit (or loss). Simple, right?
The income statement is a crucial tool for all businesses in France. In 2022, non-agricultural, non-financial trading companies recorded a gross operating surplus of 86,208.9 million euros and a pre-tax current result of 76,567.6 million euros. Discover more statistics here. These figures illustrate the importance of this document for the French economy.
Why is the income statement so important?
Beyond simply photographing your activity, the income statement is a powerful tool for steering your business and making informed decisions. It lets you:
- Measure your profitability: Know whether your activity is profitable over the long term.
- Identify your strengths and weaknesses: Understand what’s working well and what needs improvement.
- Attract investors: Present a solid, reassuring financial picture.
- Secure financing: Provide banks with the information they need to assess your creditworthiness.
- Optimize your management: Analyze the various components of the statement to identify improvement levers.
Want to deepen your knowledge of the income statement? Check out our detailed guide: Learn more about the income statement. Simplify your bookkeeping and automate the generation of your income statement with Bizyness.
Anatomy of a statement: reading between the lines like a detective
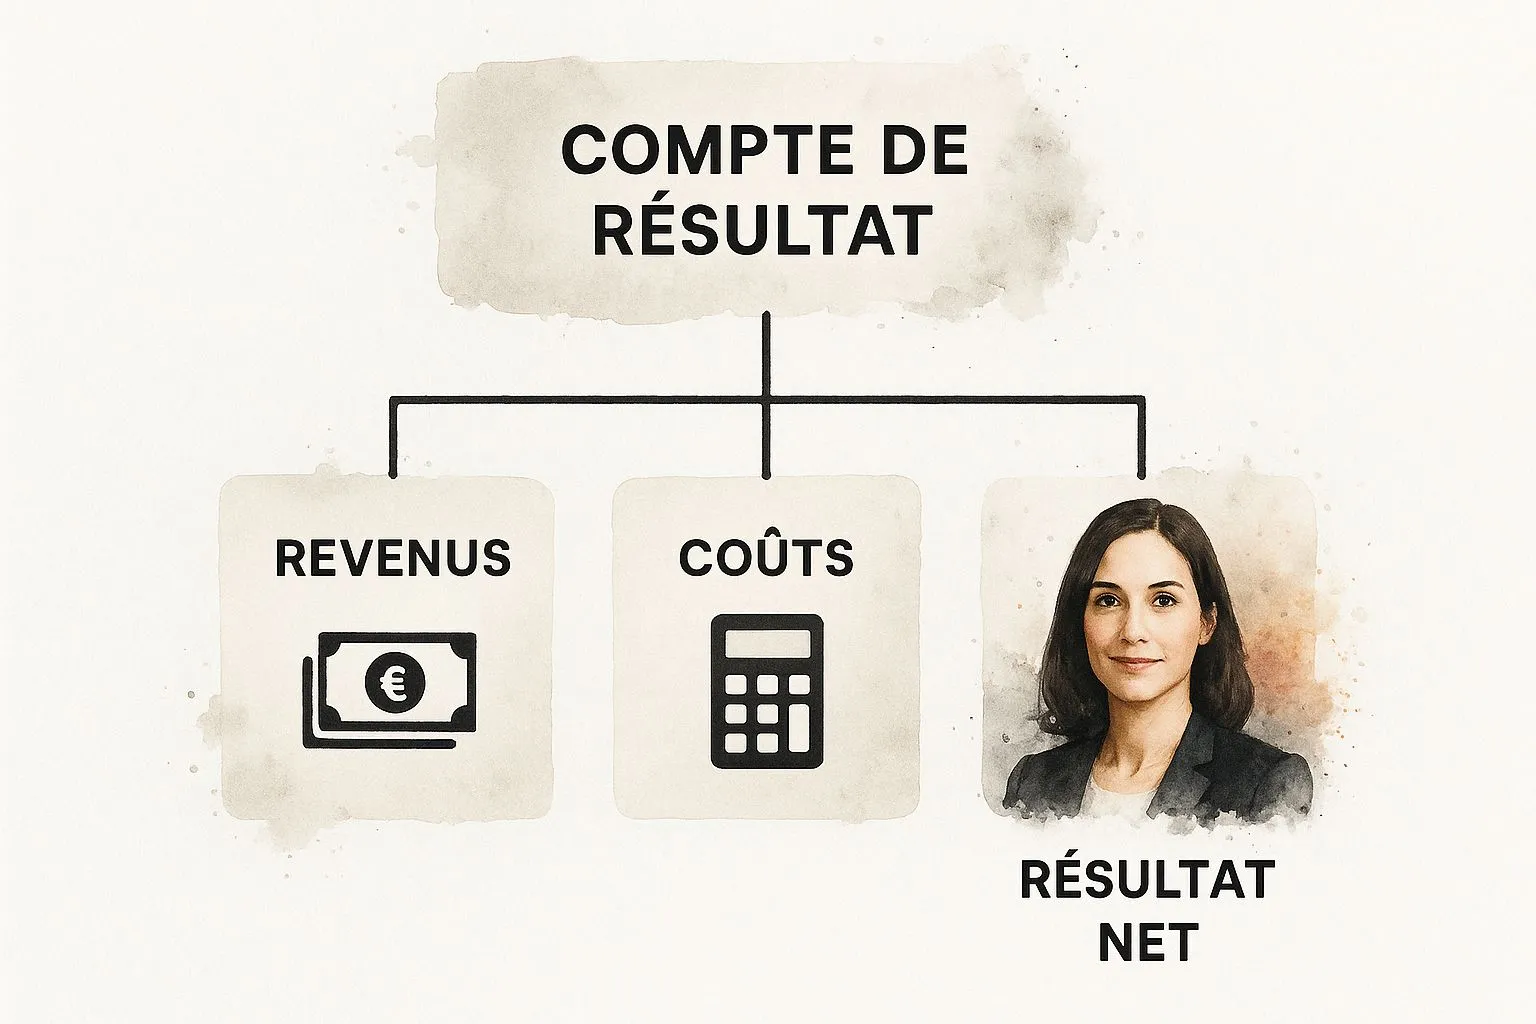
The diagram above gives us an overview of the structure of an income statement. You can clearly see the path from revenue down to net income, passing through the costs along the way. Picture a funnel: revenue enters at the top, costs are deducted step by step, and what’s left at the bottom is the net result.
After this first impression, let’s explore each part of the income statement in more detail. Much like a detective examining clues, we’ll break down each line to understand what it tells us about a company’s financial health.
Decoding revenue: the pulse of your business
The first section of the income statement presents revenue, often called turnover. It’s the heart of the business, the money generated by sales. Take the example of a restaurant: turnover represents the money received for the dishes and drinks served.
Analyzing revenue helps you understand commercial performance. A rise in turnover is generally positive, but it should be compared against other factors, such as market trends or advertising campaigns run.
Mastering costs: keeping an eye on expenses
Costs, also called expenses, represent all the spending needed to run the business. For our restaurant, this includes the cost of ingredients, staff salaries, rent, water and electricity bills, and so on. There are variable costs, which fluctuate with activity (like ingredients), and fixed costs, which stay stable (like rent).
Analyzing costs is fundamental for identifying savings opportunities and improving profitability. The restaurant owner could, for example, renegotiate supplier contracts or optimize energy consumption.
Net income: the bottom line of the period
Net income is the result of the equation: revenue minus costs. It’s the profit (or loss) achieved by the business over a given period. If revenue exceeds costs, net income is positive: the company is profitable. Otherwise, it’s a loss.
Net income is a crucial indicator for investors. It reflects the company’s profitability and its ability to generate profits over the long term. Positive, growing net income is generally seen as a sign of good financial health.
Before moving on, here’s a summary table of the elements we’ve just covered:
Detailed structure of the income statement
Comparison of the different sections of the income statement with their main components
| Section | Main components | Analysis objective |
|---|---|---|
| Revenue | Turnover, sales of products or services | Assess commercial performance |
| Costs/Expenses | Variable costs (raw materials, etc.), fixed costs (rent, salaries, etc.) | Identify levers for improving profitability |
| Net income | Revenue - Costs | Measure the company’s overall profitability |
This table summarizes the key information for each section of the income statement, making it easier to analyze and understand financial performance.
Exploring the finer points: taking the analysis further
The income statement isn’t limited to revenue, costs and net income. Other important indicators help deepen the analysis, such as EBITDA before certain items (EBE) and EBITDA (Earnings Before Interest, Taxes, Depreciation, and Amortization). The gross operating surplus measures the profitability of the core activity before accounting for exceptional items. EBITDA, meanwhile, is often used to compare the performance of companies in different sectors. Mastering these finer points gives you a sharper, more precise view of the financial situation. It’s by breaking down the income statement this way that you can truly “read between the lines” and uncover valuable insights for decision-making.
The three floors of performance: your staircase to success

Picture your business as a three-story building. Each floor represents a level of analysis within your income statement, and just like in a building, each level offers a different perspective. To get the full picture, it’s essential to understand these three levels.
Ground floor: operating income
On the ground floor, we find the heart of the business, operating income. It tells us whether the company’s core activity is profitable, without factoring in financial elements or exceptional events. Take the example of a restaurant: operating income would tell us whether selling dishes is profitable, without considering the loan repayment for the oven purchase or the sale of some furniture. Concretely, it’s obtained by subtracting operating expenses (ingredient purchases, salaries, rent…) from operating income (sales of dishes, drinks…). This floor tells us about the company’s operational efficiency.
First floor: current income
Let’s now go up to the first floor, where current income sits. Here, financial elements are factored in, such as loan interest or investment income. For our restaurant, if the owner has taken out a loan, the interest on that loan would be deducted at this level. Current income therefore gives a more precise picture of the company’s profitability by factoring in its financial structure. It’s a key indicator for assessing the sustainability of the business. A sample forecast income statement can help you visualize the impact of these financial elements.
Top floor: net income
Finally, on the top floor, we arrive at net income. This is the final result, after taking everything into account, including exceptional events. Imagine the restaurant owner sells part of their furniture: this exceptional gain would be added to current income to arrive at net income. Conversely, a large unforeseen repair would be deducted. The income statement lets you visualize these exceptional items of income and expense. To give you a sense of scale, in 2022, exceptional income for non-agricultural, non-financial trading companies in France reached 70,894.7 million euros, while exceptional expenses amounted to 71,900.0 million euros. More information on the income statement. Net income therefore reflects the company’s actual performance over a given period.
It’s essential to analyze these three floors together. Focusing on just one level could give an incomplete, or even misleading, picture of the situation. Positive operating income, for example, could be offset by heavy debt, resulting in negative net income. Looking at all three floors together helps you understand the links between core activity, financial management and exceptional events, so you can make more relevant strategic decisions.
Turning numbers into insight: the art of financial analysis
Having broken down the income statement, it’s now time to make sense of all these numbers. Much like a mechanic listening to an engine, we’ll now try to understand what the income statement tells us about a company’s financial health. How? By analyzing it to extract valuable information and turn it into concrete actions.
Profitability ratios: decoding performance
Picture a car’s dashboard. It gives you essential readings: speed, fuel level, engine temperature… Profitability ratios are a bit like the company’s dashboard. They let us assess its financial performance and understand, for example, whether it’s profitable, whether it manages its spending well, or whether it’s struggling.
To make this clearer, let’s use a simple analogy. If turnover is the total distance traveled, net margin represents the distance actually “gained” once the cost of fuel is deducted.
Here’s a summary table of the key ratios to know:
Essential profitability ratios
Comparative table of the main ratios with their formulas and interpretation thresholds
| Ratio | Formula | Interpretation | Reference threshold |
|---|---|---|---|
| Gross margin | (Turnover - Cost of goods sold) / Turnover | Measures the profitability of sales after deducting the direct cost of products. Imagine you sell lemonade: gross margin is what’s left after buying the lemons and sugar. | Varies by sector, generally > 20% is a good indicator. |
| Operating margin | Operating income / Turnover | Measures the profitability of the core activity after paying all ongoing expenses (salaries, rent, etc.). Sticking with the lemonade example, it’s what’s left after paying for the stand space and your time. | Ideally > 10%, but varies by sector. |
| Net margin | Net income / Turnover | This is the “final profit” — what really stays in your pocket after deducting all expenses, including taxes. For our lemonade stand, it’s what you can finally set aside after all the spending. | Generally targeted at > 5%, but depends on sector and strategy. |
| Return on investment (ROI) | (Investment gain - Investment cost) / Investment cost | Measures the profitability of a specific investment. If you invest in a new lemonade machine, ROI will tell you whether that investment pays off. | Varies according to the type of investment and the associated risk. |
Thanks to these ratios, you can compare a company’s performance to that of its competitors, or to its own past performance.
Time-series analysis: spotting trends
Time-series analysis is like watching a film of the company’s evolution, rather than a single snapshot. You observe changes across several periods to identify trends. For example, if expenses rise steadily every year, there may be an issue worth digging into. Conversely, if turnover keeps growing steadily, that’s an encouraging sign! To go further, you can check out this article: mastering the income statement in 3 steps.
Benchmarking: comparing yourself to the best
Picture a race. To know where you stand, you look at the other runners. That’s the principle of benchmarking: comparing your performance to that of companies in the same sector. This lets you gauge your position relative to the competition, identify strengths and weaknesses, and improve.
By combining these three types of analysis (ratios, time-series and benchmarking), you get a complete picture of your company’s financial health and can make informed decisions for the future. It’s like having a detailed map, a compass, and a good guide to steer you toward success.
Case studies: from startup to multinational

Now that we’ve covered the basics of the income statement, let’s get practical! The image above gives us a preview of what we’re about to explore: concrete examples of income statements. Much like a fingerprint, each statement is unique and reflects a company’s specific situation. Let’s look at a few case studies together to fully grasp the value of this tool.
The hypergrowth startup: investing to grow
Picture a young startup in the tech sector. Its first three income statements might show a sharp rise in turnover, but with negative net income. Strange? Not really. This situation is common because the startup is investing heavily in research and development, marketing and hiring to grow quickly. Its spending, particularly salaries and marketing costs, rises accordingly. Here, the income statement tells us that the priority isn’t immediate profitability, but growth and market conquest. A crucial indicator to track in this case is the burn rate, which represents the speed at which the startup spends its capital.
The family-run SME: stability above all
Now let’s take the example of a family-run SME specializing in craftsmanship. Its income statement will likely show more moderate turnover growth, but stable profitability. Spending is well controlled, a sign of rigorous management. Analysis of the statement might reveal an increase in depreciation, indicating investment in new equipment. The main challenge for this type of business is often handing it down to future generations. The income statement then becomes a valuable tool for assessing the company’s financial health and preparing for that transition.
The industrial company in crisis: adapting to survive
Now consider an industrial company facing difficulties. Its income statement might show declining turnover and sharply falling profitability. Analyzing expenses might reveal an increase in the cost of raw materials, linked to the economic situation, and a decrease in personnel costs, potentially due to restructuring. Here, the income statement is essential for identifying weak points and putting together a recovery plan. The company needs to adapt, cut costs, and innovate to bounce back. The statement becomes a genuine steering tool for getting through the crisis.
The importance of context: looking beyond the numbers
These three examples show that identical figures can tell completely different stories. Analyzing an income statement isn’t just about reading numbers. It also means understanding the company’s context, its industry, its strategy and its ambitions. It’s by combining number analysis with an understanding of context that you can make the right decisions. Interpreting the income statement is a skill that develops with practice. Don’t hesitate to use Bizyness to automate the creation of your statements and focus on what matters most: analysis and decision-making.
Avoiding pitfalls: common mistakes and expert best practices
Analyzing an income statement is a bit like exploring a treasure map: promising, but potentially riddled with traps. It’s easy to get distracted by misleading clues and miss the real prize. This section will help you dodge the most common pitfalls and sharpen your analytical instincts like a true expert.
The turnover mirage: profitability comes first
Picture an ice cream vendor in the height of summer. They sell hundreds of cones a day, and turnover is booming! But if they sell them at a bargain price that barely covers costs, they risk ending the season with more debt than profit. High turnover is appealing, but you should never lose sight of the main objective: profitability. Analyzing the income statement should therefore focus on gross margin and net margin, true indicators of a company’s financial health.
Accounting adjustments: beware of manipulation
Accounting standards offer a certain amount of flexibility, a bit like the rules of a board game. Some “adjustments” are allowed, but be careful! Some players might be tempted to use these rules to their advantage to artificially inflate their score. For example, a company might defer recording certain expenses to boost its short-term results. It’s therefore crucial to analyze the income statement with a critical eye and fully understand the impact of accounting choices on the figures presented.
The relativity of ratios: adapting your analysis to the sector
Financial ratios are like tools in a toolbox: each has its own specific use. A hammer is perfect for driving a nail, but much less useful for tightening a bolt. Similarly, a ratio considered excellent in the luxury sector might be alarming for a supermarket. Comparing apples to oranges doesn’t make sense! Analyzing the income statement must therefore be put in context and take into account the specifics of the company’s industry.
The experts’ secrets: thinking critically and communicating clearly
The best analysts don’t just settle for raw numbers. They dig, look for explanations, and ask the right questions. Here are a few of their tricks:
- Put results in context: What’s the economic environment? What’s the company’s strategy?
- Ask the right questions: Why did turnover decline? How can this rise in expenses be explained?
- Present analyses clearly: Charts, tables and clear language make information accessible and easy to understand.
Bizyness: your ally for meaningful analysis
Imagine being able to generate your income statement in one click, with no risk of data-entry errors. That’s what a tool like Bizyness offers you. You save time and can focus on what matters most: analysis and decision-making. With clear dashboards and key indicators, Bizyness helps you steer your performance and identify improvement levers.
By following this advice and using the right tools, analyzing your income statement will become a powerful asset for your business, letting you make informed decisions and reach your goals.
The future of the income statement: tools and technology
The income statement. Once synonymous with endless spreadsheets and recurring headaches, it’s now entering a new era. Gone is manual data entry and tedious calculations — welcome to automation and artificial intelligence.
Automation: the end of data-entry errors
Imagine no longer needing to spend hours entering numbers into a spreadsheet. With automation, your financial data is retrieved and fed directly into your income statement. It’s like having a tireless accounting assistant working around the clock. The time savings are considerable, and the risk of human error is nearly eliminated. You can finally focus on analyzing your performance and making strategic decisions.
A real relief for entrepreneurs and finance managers! Automation frees up valuable time for higher-value tasks.
Artificial intelligence: anomaly detection
Artificial intelligence (AI) brings a new dimension to financial analysis. Like a seasoned detective, it scans your data looking for anomalies, hidden trends, and early warning signs. Unusual variations? Suspicious fluctuations? AI alerts you immediately, letting you react quickly and anticipate risks. It becomes a true ally for optimizing your performance and making informed decisions.
Imagine being able to spot potential problems before they even happen. That’s the power of AI applied to the income statement.
Above, a preview of the Bizyness interface. Notice how clearly the data is presented. Access to key information is simplified, making it easier to understand and analyze the income statement.
Interactive dashboards for dynamic analysis
Forget static, hard-to-interpret reports. Interactive dashboards give you a dynamic, personalized view of your performance. You can view your data from different angles, explore specific periods, and simulate scenarios. It’s like having an interactive map of your finances, letting you navigate with precision and quickly spot growth levers.
Interactivity enables in-depth analysis and a better understanding of the factors influencing your results. Automatic report generation, with built-in controls and custom alerts, also simplifies tracking your business.
In conclusion, the income statement is undergoing a real transformation. Thanks to automation, AI and interactivity, it’s becoming a powerful tool for steering and decision-making. You save time, reduce errors, and improve the quality of your decisions. Simplify your bookkeeping and automate the generation of your income statement with Bizyness.
