

 Français
Inventory Management in Excel: Simple and Effective
Master inventory management in Excel. This guide shows you how to build a powerful, automated tool to track your stock without the hassle.

Despite the rise of specialized software, managing inventory in Excel remains a powerful and accessible solution for a great many small and medium businesses. With a bit of organization, a spreadsheet can become a fantastic personalized tracking tool. It lets you keep an eye on incoming and outgoing stock and set alert thresholds, all without investing in software solutions that are often complex and costly.
Why Excel still holds its own for inventory management

In an era where cloud solutions and dedicated software get all the attention, running your inventory with Excel can seem a bit old-fashioned. Yet for many small businesses, this tool everyone already knows is far from obsolete. Its real strength is its near-infinite flexibility and negligible cost, since it’s already part of most companies’ office suite.
Where dedicated software imposes its own structure, a well-designed Excel file adapts to your way of working, not the other way around. Managing handcrafted products with unique batch numbers? Juggling hundreds of electronic component references? Excel gives you the freedom to build a system that fits your reality perfectly.
A tool proven in the field
Excel’s ubiquity in business no longer needs proving. It’s the go-to reflex for organizing data, and inventory management is no exception.
Excel has a knack for turning a task that can feel intimidating into a visual, logical process. It demystifies inventory management and makes it accessible, giving business owners direct control over an essential facet of their operations.
This popularity isn’t just an impression. A recent study found that 67% of French companies still rely on Excel to track inventory and customers. The spreadsheet is even the leading data management tool in France, with a 47% market share, far ahead of specialized CRM and ERP systems. For those who want to dig deeper, the study is available in detail on crm-pour-pme.fr.
Far more than a simple item list
The approach we’re going to explore here goes well beyond a simple table listing your products. The goal is to turn a static spreadsheet into a genuine dynamic dashboard. Think of it as the control center for your inventory, capable of sending you alerts and giving you a clear view at any moment. This kind of data mastery is, in fact, a key principle found in other areas of management too, as we explain in our guide on accounting in Excel.
By following a few best practices, you’ll end up with a tool that gives you:
- Total control: You decide every column, every formula, every alert.
- A clear view: Thanks to conditional formatting, you spot low stock or slow-moving products at a glance.
- An economical solution: No monthly subscription fees or costly licenses.
- A quick learning curve: Most of your team already knows the basics of Excel.
This guide will show you how to harness this potential to turn your Excel inventory management into a genuine strategic asset.
Excel or dedicated software: what should you choose for your inventory?
The choice between Excel and dedicated software really depends on the size and complexity of your business. To help you see things clearly, here’s a comparison table summarizing the strengths and weaknesses of each solution.
| Criteria | Inventory management in Excel | Dedicated inventory software (ERP/WMS) |
|---|---|---|
| Cost | Very low (often included in the Office suite) | License or subscription cost (often high) |
| Flexibility | Very high (fully customizable) | Limited by the software’s features |
| Learning curve | Fast for users familiar with Excel | Requires specific training |
| Automation | Limited (macros, formulas) | Advanced (e-commerce connections, scanners, etc.) |
| Collaboration | Possible but complex (risk of errors) | Designed for real-time teamwork |
| Security | Depends on internal policies (file access) | High (access rights management, backups) |
| Best for | Small businesses, simple stock, tight budgets | Growing SMEs, mid-size companies, complex stock |
In short, Excel is a fantastic starting point — economical and ultra-flexible. However, if your order volume explodes, if several people need to work on inventory simultaneously, or if you need to sync your data with other platforms (like an e-commerce site), it will be time to consider a specialized solution.
Laying the groundwork for your tracking file
For an Excel inventory management system to be truly effective, everything starts with a well-thought-out structure. Before even diving into complex formulas or colorful charts, you need to build solid, logical foundations. From experience, the best approach by far is to organize your workbook into three distinct tabs.
Each tab will have a precise role. This separation is crucial to avoid ending up with one of those “catch-all” files that become a real nightmare to maintain. Think of each tab as a specialized database; this will make life much easier when it’s time to analyze your data and automate certain tasks.
The three pillars of your inventory management
The structure I suggest is built around three worksheets that work together. It’s a bit like a well-oiled filing system where every piece of information has its designated place.
- Products: This is the heart of your inventory. This tab will list all your items once and for all, along with their characteristics that don’t change (or barely do).
- Inbound: Here, each new row corresponds to a goods receipt. It’s the logbook of everything that arrives in your warehouse.
- Outbound: Logically, this tab will record every sale or stock outflow. It’s the history of everything that leaves your inventory.
This method, based on logging every movement, is far more powerful than a simple table where you manually adjust a quantity. It gives you full traceability and lets you know exactly what happened, and when.
The essential columns for each tab
For this system to work, each tab needs to contain the right information, well structured. Here are the columns I consider essential to get started.
In your ‘Products’ tab:
- SKU (Stock Keeping Unit): This is a unique identifier for each product (for example, TSHIRT-BLUE-M). It’s the most important column in the system, since it links all your tabs together.
- Name: The full name of your product, so everyone can find it easily.
- Supplier: The name of the item’s main supplier.
- Purchase price (excl. VAT): How much this product costs you, per unit.
- Alert threshold: The stock level that, once reached, should prompt you to reorder.
For the ‘Inbound’ and ‘Outbound’ tabs:
These two will have an almost identical structure, since their purpose is the same: tracking movements.
- Date: The exact day the movement took place.
- SKU: The unique identifier of the product concerned (matching the one in the ‘Products’ tab).
- Quantity: The number of units that came in or went out.
- Comment (optional): A handy field for noting an order reference, an invoice number, or the reason for an unusual outflow.
Data integrity is the key to everything. Nearly all errors in this type of file come from inconsistent SKU entry. A simple typo, like “TSHIRT-BLUE-M” instead of “TSHIRT-BLU-M”, and Excel will think these are two different products. Your stock calculations will then be completely thrown off.
Fortunately, there’s a simple but incredibly effective trick to avoid this trap: drop-down lists. By forcing SKU entry to come from your already-defined product list, you eliminate any risk of error.
This image, taken from Microsoft’s official help, shows exactly where to find this data validation option.

In the data validation window, simply choose “List” and specify your SKU column (from the ‘Products’ tab) as the source. And that’s it! It becomes impossible to enter an SKU that doesn’t exist in your movement tabs. This small touch of rigor from the start is what will guarantee the reliability of your entire system in the long run.
Bring your tracking to life with the right formulas
Now that your data is well structured, it’s time to make the numbers work for you. A good Excel inventory management system doesn’t just list products; it works for you. We’re going to turn this static table into a dynamic tool that calculates, analyzes, and alerts you automatically.
The idea is to let Excel do the tedious work for you. No more manual calculations and the errors that come with them. With a few well-chosen formulas, your different tabs will communicate with each other, giving you a real-time overview of your stock and even helping you anticipate shortages.
Get a real-time snapshot with SUMIF
The first thing to automate is calculating the current stock for each product. And for that, the SUMIF function is your best friend. It can find and add up all the quantities linked to a specific product (via its SKU) across your ‘Inbound’ and ‘Outbound’ tabs.
Concretely, in your ‘Products’ sheet, add three new columns:
- Total Inbound:
=SUMIF(Inbound!B:B; A2; Inbound!C:C) - Total Outbound:
=SUMIF(Outbound!B:B; A2; Outbound!C:C) - Current Stock:
= [Total Inbound cell] - [Total Outbound cell]
With this structure, every new inbound or outbound entry you log will update the stock instantly. No more pointing at cells or recalculating anything.
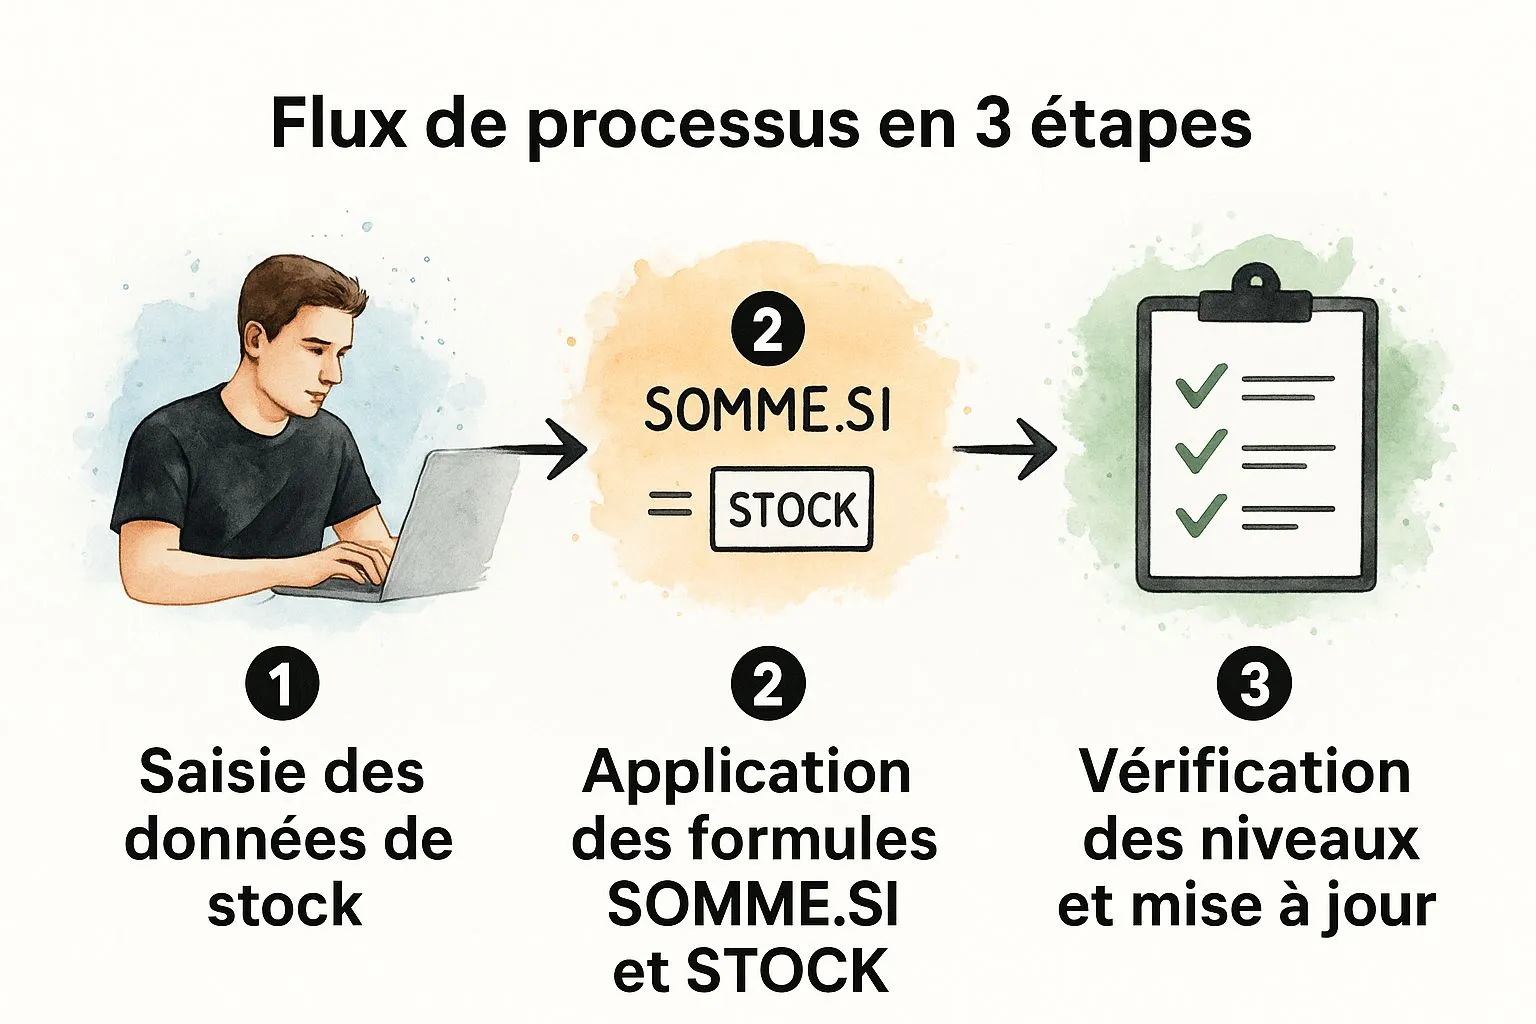
As this visual clearly shows, the key to everything is rigor in data entry. Clean input data guarantees reliable, automated tracking.
To help you keep track, here’s a quick recap of the formulas that will become essential.
| The key Excel formulas for your inventory management | ||
|---|---|---|
| Excel formula | Main function | Example use |
SUMIF | Adds up values that meet a specific criterion. | Calculate the total inbound quantity for product SKU-001 by searching the ‘Inbound’ tab. |
IF | Displays one value if a condition is true, and another if it’s false. | Display “Reorder” if current stock is below the alert threshold, otherwise display “OK”. |
VLOOKUP | Looks up a value in the first column of a table and returns a matching value. | Automatically retrieve a product’s name by simply entering its SKU. |
CONDITIONAL FORMATTING | Applies a format (color, icon) to a cell if it meets a rule. | Highlight in red the row of a product whose status is “Reorder”. |
These few functions are the foundation of an effective, responsive dashboard.
Create smart alerts with the IF function
Knowing how much of a product you have left is good. Knowing when to reorder it is better. That’s where the IF function becomes very handy. By combining it with the alert threshold defined earlier, you set up an immediate visual alert system.
Add a “Status” column and enter this simple formula:
=IF([Current Stock cell] <= [Alert Threshold cell]; "Reorder"; "OK")
And there you go! As soon as an item’s stock drops below the critical threshold, the “Reorder” message appears. It’s a valuable time-saver that spares you from having to scan through your entire product list. This little trick is a first step toward what’s known as business process automation, a powerful lever for boosting your efficiency.
Expert tip: Don’t stop there. Pair this
IFformula with conditional formatting. You could, for example, tell Excel to automatically highlight an entire row in red for a product that needs reordering. The visual impact is immediate, and you’re certain never to miss a critical piece of information again.
Take your inventory analysis further
Using Excel to manage inventory is a reflex for many businesses. It’s estimated that in France, around 80% of small and medium businesses rely on it for its flexibility. Yet most stick to the basic functions, missing out on much richer analytical potential.
Don’t make that mistake. More advanced functions like FORECAST or TREND can analyze your sales history to help you anticipate future demand. It’s an excellent way to adjust your stock levels based on market trends or seasonality, and thereby optimize your cash flow.
By mastering these few formulas, you no longer just track your inventory: you drive it. Your Excel file becomes a genuine assistant that helps you make better purchasing decisions, reduce costs linked to overstocking, and above all, never miss a sale again because of an unexpected stockout.
Visualize your data with a dynamic dashboard
An Excel inventory management file overflowing with numbers and formulas is a good foundation. But to truly steer your business and make quick decisions, you need to turn this mountain of raw data into something visual, something that speaks for itself. The goal is simple: at a single glance, you should know what’s happening in your warehouse, without having to squint at hundreds of rows.
That’s where the dashboard comes in. By leveraging Excel’s charting tools, you’ll build a genuine command center for your inventory. This will be much more than simple tracking; it will be a powerful communication tool for reviewing the health of your stock with your team or partners.
Summarize your movements with pivot tables
Before thinking about nice charts, you first need to make the numbers speak, to summarize them. And for that, the king of tools in Excel is the pivot table. It can take your long lists of inbound and outbound entries and turn them into clear, and above all interactive, summaries.
Imagine wanting to know the total number of products sold, month by month. Instead of diving into complex filters and sum formulas, a pivot table gives you the answer in three clicks. It’s the perfect tool for answering very concrete questions:
- What’s the outbound volume for each product reference?
- How many units did I receive from a given supplier this quarter?
- What’s the sales trend for this item over the last six months?
Getting started is very simple. Select all the data in your ‘Outbound’ tab, then head to the Insert > PivotTable menu. I recommend always placing it on a new worksheet; it’s a good practice to keep your file clean and well organized. Then all that’s left is to drag the fields (‘Date’, ‘SKU’, ‘Quantity’, etc.) into the different zones to build your custom analysis.
Highlight key insights with striking charts
Once your data is well summarized thanks to the pivot table, charts will bring it to life. We all know a good chart tells a story much faster than a table of numbers.
Here are a few examples of visuals that work very well for inventory tracking:
- The best-seller bar chart: A simple bar chart to display your top 5 or top 10 fastest-moving products. Ideal for spotting your star products at a glance.
- The stock evolution curve: Very useful for a strategic product. A curve showing stock levels over several weeks or months will help you better anticipate future restocking.
- The pie chart: Perfect for visualizing the breakdown of your stock value by product category.
Conditional formatting is your best ally for instant readability. It’s a simple technique with a huge impact on the clarity of your tracking. By automatically coloring stock cells red when they fall below the alert threshold, you turn your table into a visual alert system that draws the eye to urgent items.
To go further, the ideal is to group all these elements into a dedicated tab. For advice on designing truly effective dashboards, feel free to check out our detailed article on building a management dashboard that centralizes all your indicators. The idea is to bring your charts and key figures together on a single page for a full, 360-degree view.
Protecting and maintaining your inventory management spreadsheet

Your Excel inventory management file is much more than a simple document. It’s the true dashboard of your business, compiling crucial data about your products, costs, and sales. It’s therefore absolutely essential to keep it in top shape and protect it from handling errors or prying eyes.
Setting up an effective system is one thing. But making sure it stays reliable and accurate over the long run is another. It comes down to a few best practices, often overlooked, that can literally save the day.
Securing sensitive data
The first thing to do is control who can change what. Don’t worry, Excel offers very simple and effective tools for this. The idea is to lock all the cells containing your precious formulas, while leaving accessible the ones where you enter inbound and outbound stock.
Concretely, here’s how to do it:
- Start by selecting the cells you want to leave editable (for example, the quantity and reference columns in your movement tabs).
- Right-click your selection, choose Format Cells, then go to the Protection tab and uncheck the “Locked” box.
- Next, head to the Review tab on the Excel ribbon, where you’ll click Protect Sheet. All that’s left is to choose a password, and you’re done.
This simple step will save you a lot of headaches by preventing accidental changes that could throw off all your calculations. It’s a basic but essential safeguard.
Managing multi-user collaboration on the file
We all know that several people working on the same Excel file can quickly turn into a nightmare. The risk of creating conflicting versions or overwriting a colleague’s work is very real. Studies also show that 65% of users struggle with collaborative file updates. Security is also a real concern: 40% of companies worry about the confidentiality of their data in Excel. To dig deeper into these challenges, you can take a look at this information on file management.
To avoid chaos, the ideal solution is to use a version of Excel that allows real-time co-editing, such as with a Microsoft 365 subscription. If that’s not an option for you, designate a single person as “keeper” of the master file. It will be their role to integrate everyone’s updates.
The critical importance of regular backups
It can’t be said enough: an error can happen in an instant. One wrong move, a computer crash, and months of stock data can vanish in a second. Your only insurance against this kind of disaster is a rock-solid backup routine.
And I’m not just talking about hitting “Save”. You need a real strategy in place.
- Daily backups: Get into the habit of making a copy of your file at the end of each workday.
- Version history: Name your copies with the current date (for example,
Stock_2023-10-26.xlsx). This will let you easily roll back if needed. - External storage: Don’t keep all your eggs in one basket. Keep at least one copy on a cloud service (like OneDrive or Google Drive) or on an external hard drive.
This discipline might seem a bit tedious at first, but trust me, it’s what will guarantee the survival of your inventory management system against any unexpected event.
FAQ: common questions about inventory management with Excel
When you get started with inventory management in Excel, you quickly run into a few legitimate questions. That’s perfectly normal! Let’s go through the most frequent questions to clear up any doubts and help you get started on the right foot.
Can my Excel file really handle a large number of products?
Yes, absolutely, but on one condition: flawless organization. Excel can easily juggle thousands of references. How responsive your file stays will mainly depend on the complexity of your formulas. A friendly tip: to keep things running smoothly, avoid applying complex formulas, like array formulas, to entire columns.
How can I avoid data entry errors?
Let’s be honest, the reliability of your stock tracking depends entirely on the quality of the data you enter. The most common mistake? A simple typo in a product reference (SKU), and your whole stock calculation becomes wrong. To guard against this, the simplest and most effective solution is data validation.
Concretely, use drop-down lists for important fields like product references. This way, the user is forced to choose an existing item, which almost completely eliminates the risk of error. Also remember to lock the cells containing your formulas to prevent a mishandling from breaking everything.
The key to good inventory management in Excel isn’t so much the complexity of the formulas as the rigor of the structure. A simple, well-locked system will always be more reliable than an overly complex setup where errors can creep in everywhere.
Can you connect your Excel spreadsheet to other software?
Yes, it’s entirely possible to have your Excel file communicate with other tools, even though it requires somewhat more advanced skills. Here are a few avenues to explore:
- Data connections: The Power Query tool, built directly into Excel, is a real gem for this. It can connect to a wide range of sources (SQL databases, CSV files from your point-of-sale software, etc.) to automatically import your sales data, for example. No more double data entry!
- VBA macros: For those not afraid to get their hands into the code, macros can automate repetitive tasks. Imagine being able to generate and email a stock report in a single click, or export your data in a specific format for another piece of software.
By mastering these techniques, your simple spreadsheet turns into a genuine mini command center, far more powerful and less dependent on manual data entry.
Take it to the next level and fully automate your management. With Bizyness, forget about formulas and focus on your growth. Discover the solution designed for you on Bizyness.fr.
