

 Français
 The inventory turnover ratio, your true performance indicator
Learn how to calculate and interpret your inventory turnover ratio to optimize your cash flow and transform your inventory management.

The inventory turnover ratio is a bit like the pulse of your e-commerce business. In concrete terms, this indicator measures how many times your entire stock is sold, then replenished, over a given period — typically a year. It’s the direct reflection of how fast you turn your products into cash.
Why inventory turnover is a vital indicator

Picture every product in stock as a banknote sitting dormant on a shelf. The turnover ratio simply tells you how often those banknotes come back into your till, ideally with a healthy margin. A high rate is often a sign of excellent commercial health and well-oiled management.
Conversely, a rate that’s too slow should raise a red flag. It’s the symptom of two major problems that every online seller, whether on Shopify or Amazon, dreads:
- Overstocking: This is the classic trap. You’re tying up your cash in items gathering dust. Worse, it generates storage costs and increases the risk of having to discount products that have become obsolete.
- Stockouts: This is lost revenue in its purest form. A customer wants to buy, but the product isn’t there. They go to a competitor, and you lose a sale that was within reach.
The art of finding the right balance
The goal isn’t to reach the highest possible rate at any cost, but to find the ideal equilibrium point. The Holy Grail is maximizing sales without freezing excessive capital in stock. This indicator is therefore not just an accounting figure — it’s a genuine strategic lever for driving your growth.
By mastering your turnover ratio, you’re not just managing products. You’re taking control of your cash flow and your company’s profitability.
A metric that has sped up over time
Inventory management has undergone a real revolution. To give you an idea, in the 1990s, retail trade in France ran at around 4 stock turns per year on average. Today, with the explosion of e-commerce, flows have accelerated incredibly. Online sellers must show far more agility to stay in the race.
Understanding this figure is the first step to turning it into a competitive advantage. It’s one of the key performance indicators for a business that wants to be modern and high-performing. Let’s now see how to calculate it, interpret it correctly and, above all, how to improve it.
How to calculate your inventory turnover ratio, step by step
Let’s get to the heart of the matter: how do you actually calculate this famous inventory turnover ratio? Forget the complex formulas reserved for accountants. The operation is actually quite simple, and it’s precisely this simplicity that makes it such a powerful tool for any online seller.
The basic formula for finding out how fast your products leave your shelves is as follows:
Inventory Turnover Ratio = Cost of Goods Sold (COGS) / Average Inventory Value
The result gives you a very telling figure: it indicates how many times you sold and replenished your entire stock over a given period. If you get 6, for example, that means you emptied and refilled your inventory six times over the year.
To arrive at this figure, you first need to calculate the two elements that make up the formula: COGS and Average Inventory.
Step 1: Determine the cost of goods sold (COGS)
The Cost of Goods Sold, or COGS, is simply what the products you actually sold cost you. Be careful — we’re not talking about your revenue here, but rather the purchase price of that merchandise from your suppliers. It’s the gross cost of your inventory sold.
So where do you find this information? It’s often simpler than you’d think:
- Your payment platforms: Services like Stripe or PayPal let you export very detailed transaction reports. In just a few clicks, you can isolate the costs associated with your sales.
- Marketplaces: If you sell on Amazon FBA, for example, the platform provides sales reports that already contain this precise data.
- Your management or accounting software: This is the most direct solution. A tool like Bizyness, for example, syncs with your sales channels and calculates your COGS automatically. A real time-saver.
Step 2: Calculate your average inventory value
The second piece of the puzzle is the average inventory value. Why “average”? Because your stock level fluctuates constantly: you receive deliveries, you ship orders… Using the stock value at a single point in time would give a completely skewed result. Average inventory smooths out these variations and gives a much more accurate picture of reality.
The most straightforward calculation method is as follows:
Average Inventory = (Inventory value at the start of the period + Inventory value at the end of the period) / 2
Choosing the period is key and should match your business reality:
- Annual: This is the standard for a global analysis of your company’s performance.
- Quarterly or monthly: This is much more relevant if you sell seasonal products or want to quickly measure the impact of a new marketing campaign.
A good habit is to keep clear documentation of your stock levels, for example via a well-structured Excel file. This will let you retrieve these values effortlessly when it’s time to run your calculations.
A concrete example with a WooCommerce store
Let’s put this into practice. Imagine a store selling sports accessories on WooCommerce, and let’s analyze its performance over a full year.
-
Inventory value on January 1: €20,000
-
Inventory value on December 31: €30,000
-
Total cost of goods sold over the year (COGS): €150,000
-
First, the average inventory: (€20,000 + €30,000) / 2 = €25,000 The average value of its inventory throughout the year was therefore €25,000.
-
Then, the inventory turnover ratio: €150,000 (COGS) / €25,000 (Average Inventory) = 6
This store’s turnover ratio is 6. In other words, it managed to sell and replenish the equivalent of its entire inventory six times over the year. Not bad!
Going further: converting the ratio into days of storage
This figure of “6” is useful, but it can be made even more concrete. All you have to do is translate it into average storage duration. The idea is to know how many days an item spends, on average, on your shelves before being shipped to a customer.
The formula is child’s play:
Average Storage Duration = 365 days / Inventory Turnover Ratio
Going back to our example: 365 / 6 = 60.8 days
That’s valuable information! Concretely, a product stays in stock for a little over 60 days on average before finding a buyer. It’s this kind of data that lets you make informed decisions to optimize future orders and better manage your cash flow.
Turning your turnover ratio into strategic decisions
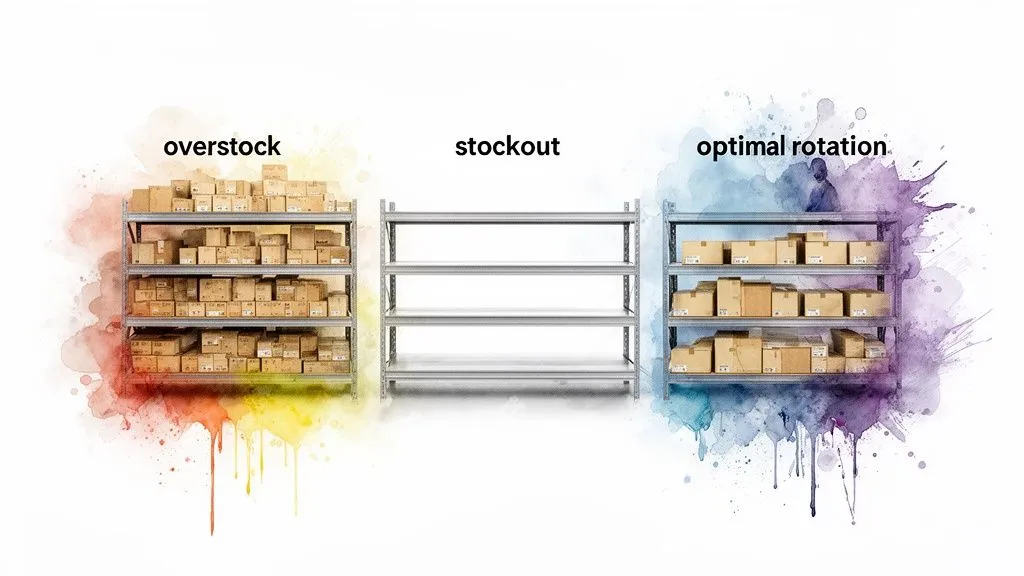
Calculating your inventory turnover ratio is good. But this figure, taken out of context, doesn’t say much on its own. Its true value is revealed when you learn to read it, to make it speak, in order to make the right decisions. That’s when this indicator becomes a real asset for steering your business.
Think of this ratio as a diagnosis of your inventory’s health. It tells you whether your pace is too slow, too fast, or perfectly aligned with your customers’ demand. Let’s look together at what each scenario concretely means for your cash flow, your margins, and your customer relationships.
When your turnover ratio is too low
A sluggish turnover ratio is often the symptom of a well-known ailment: overstocking. In plain terms, your products are piling up faster than they’re selling. Imagine a ratio of 1. That means it takes you a full year to completely replenish your inventory. The consequences are immediate and painful.
First, your cash is held hostage on your shelves. That money, tied up in boxes gathering dust, can’t be used to fund your marketing, develop new products, or even pay your suppliers. Your working capital requirement (WCR) skyrockets, because you’re financing stock that’s just sitting there.
On top of that come holding costs: warehouse rent, insurance, handling… And then there’s the risk of obsolescence. In fashion or tech, a product left unsold for a few months can lose all its value, forcing you to discount it just to get rid of it. The result? Your margins melt away.
The hidden danger of a turnover ratio that’s too high
At first glance, a very high turnover ratio might seem like great news. You’d imagine products are flying off the shelves. But watch out — the opposite excess is just as risky. It’s often an early warning sign of understocking and recurring stockouts.
Every stockout is a missed sale. Worse, it’s a disappointed customer who may well head to a competitor and never come back. You put in considerable effort to attract a visitor, only to tell them the product is unavailable. Frustrating, isn’t it? Over time, it’s your reputation and customer loyalty that suffer.
A rate that’s too fast can also mask logistical problems. You might be placing orders that are too small and too frequent, which drives up your shipping costs and administrative workload. Along the way, you’re also missing out on the volume discounts you could negotiate on larger orders.
The goal isn’t to reach the highest possible turnover ratio, but to find the optimal rate. It’s that delicate balance where you have just enough stock to meet demand, without ever tying up a single euro unnecessarily.
How to benchmark yourself against your industry
So, what’s a “good” turnover ratio? The answer is simple: it depends. An online produce seller will have a rate counted in the dozens, or even more, over a year. Conversely, a seller of luxury sofas will settle for a much lower rate. It’s all a matter of context.
To give you a more precise idea, it’s essential to compare yourself with other players in your market.
Inventory turnover benchmarks by e-commerce sector
This table presents the average turnover ratios observed in various key e-commerce sectors, along with the corresponding storage duration. These benchmarks help sellers compare their performance against their market.
| E-commerce sector | Average annual turnover ratio | Average storage duration (in days) |
|---|---|---|
| Fashion and Apparel | 4 – 8 | 46 – 91 days |
| Electronics | 5 – 10 | 37 – 73 days |
| Beauty and Cosmetics | 3 – 6 | 61 – 122 days |
| Home and Decor | 2 – 4 | 91 – 183 days |
| Fast-moving consumer goods | 10 – 20 | 18 – 37 days |
This table shows it clearly: performance is relative. What matters is measuring yourself against companies of comparable size and sector. If you’re well below your industry average, it’s a strong signal that it’s time to optimize your supply management.
Tools like Bizyness make life easier by centralizing all your sales and cost data. They let you keep an eye on this vital indicator in real time so you can fine-tune your purchasing strategy.
Put concrete actions in place to optimize your turnover
Understanding your inventory turnover ratio is a first step, that’s for sure. But the real magic happens when you take action. Knowing that your turnover is 4 when your sector targets a 6 gives you a direction. It’s time to turn this analysis into strategies that will really move the needle.
Think of this section as a toolbox. Whether your store runs on PrestaShop, WiziShop or another solution, you’ll find concrete levers here that you can activate right away. The goal? Make your inventory management more agile, more responsive, and above all, much more profitable.
Refine your demand forecasts
The first lever, and probably the most powerful, is learning to better read the future. Good sales forecasting is the cornerstone of healthy inventory. It’s what lets you order the right quantity, exactly at the right time.
To do this, you need to get your hands dirty and dive into your data. Your sales history is a genuine goldmine.
- Break down seasonality: Spot the peaks and troughs throughout the year. Do your sweaters sell like crazy in winter? Does gardening equipment fly off the shelves in spring? These are rhythms to know by heart.
- Identify underlying trends: Are certain products gaining steady momentum? Are others clearly on the decline? This information is crucial for adjusting your future orders.
- Measure the effect of your marketing campaigns: Did a promotion empty a product’s stock in just a few days? Keep that in mind for the next campaign.
A thorough analysis of these points will help you avoid the two classic traps: overstocking, which ties up your money, and stockouts, which frustrate your customers.
Move stock with smart promotions
Even with the best forecasts in the world, some products will inevitably gather dust. They’re called slow-movers — those dormant items that drag down your turnover ratio and freeze your cash.
The goal is to get rid of them, but without giving away your work and crushing your margins in the process. That’s where well-thought-out promotions come into play.
Did you know? In fashion, a key sector of French e-commerce, a good turnover ratio sits between 4 and 8 times per year. That means stock stays on average between 46 and 91 days. It’s an essential benchmark for sellers juggling seasonal collections.
Instead of jumping straight to a -70% sale, try more nuanced approaches:
- Bundling: Pair a slow-selling product with one of your best-sellers. Offer the bundle at an attractive price. You increase the perceived value for the customer and quietly clear your dormant stock.
- “Buy 1, get the 2nd at -50%” type offers: An excellent technique to encourage volume purchases on a specific item. It’s simple, effective, and it clears shelves.
- Gift with purchase: Offer a slow-moving product as a gift for any order above a certain threshold. Not only does it free up space, but it can be the little nudge that triggers the purchase.
Gain agility with your suppliers
Your relationship with your suppliers is another front where you can score points. Closer collaboration can bring you flexibility that changes everything.
One crucial topic to put on the table: the Minimum Order Quantity (the famous MOQ). MOQs that are too high force you to place large orders, which mechanically drives up your average inventory and slows your turnover.
Don’t be afraid to discuss it. Explain to your supplier that smaller but more frequent orders would be much better for your cash flow and would strengthen your partnership in the long run. Sometimes, paying a slightly higher unit price is a smart trade-off for gaining that precious agility.
Modernize your inventory management methods
Finally, to really take your management to the next level, sometimes you need to dare to try new approaches. The old model of “stock as much as possible so you never run out” has had its day. For tangible results, well thought-out in-store inventory management is essential.
Explore alternatives for some of your SKUs:
- Just-in-Time (JIT): The principle is simple: receive merchandise only when it’s needed to fulfill a customer order. This drastically reduces stock levels, but be careful — it requires impeccable logistics and thoroughly reliable suppliers.
- Dropshipping: This is the perfect solution for certain products, such as very bulky items or those that sell poorly. You hold no stock at all. The supplier ships directly to the end customer. For these items, the financial risk tied to inventory is simply zero.
By combining these different strategies, you’re not just enduring your stock problems. You’re building a proactive system that keeps your inventory moving, frees up your cash, and makes your e-commerce business stronger and more profitable.
Managing your stock turnover through automation

Calculating your inventory turnover ratio by hand, in a spreadsheet, isn’t just tedious — it’s also risky. One small data-entry mistake, one poorly dragged formula, and your entire analysis is thrown off. The result? You order too much, or not enough. This manual tracking quickly becomes a time sink, pulling you away from what really matters: growing your business.
Fortunately, automation changes the game. Instead of chasing numbers, you let them come to you, already processed, clear and ready to use. That’s the whole promise of a tool like Bizyness: turning an accounting chore into a genuine strategic steering lever.
Centralizing information to put an end to errors
The secret to reliable tracking is bringing everything together in one place. Modern platforms connect directly to your revenue and inventory sources. They create an ecosystem where information is consistent and always fresh.
Imagine never having to juggle between exports from your Shopify store, reports from your Amazon account, and statements from Stripe or PayPal ever again. Everything is synchronized.
- Connection to sales platforms: Every order (products, quantities, costs) is imported automatically. No more copy-pasting.
- Payment integration: Transactions are reconciled effortlessly, ensuring your Cost of Goods Sold (COGS) is calculated on a solid basis.
- Inventory synchronization: Your stock levels are updated in real time. You have a precise view of your average inventory at any given moment.
By connecting your tools directly, you eliminate manual entry, which is the cause of the vast majority of accounting errors. Your indicators, including your turnover ratio, instantly become more reliable.
This approach puts an end to flying blind. You no longer depend on a quarterly calculation done in a rush, but on a continuous data flow that reflects the reality of your business, day after day.
From automatic calculation to alerts that anticipate
Once the data is centralized, automation shows its true strength. A tool like Bizyness doesn’t just store information — it makes it speak for you.
Calculating COGS, an often laborious step, becomes instant. The platform analyzes sales and their related costs to give you a precise figure, without you having to lift a finger. The inventory turnover ratio is then automatically generated and presented in visual, easy-to-read dashboards.
But the real advantage lies elsewhere. Automation shifts you from reactive management to proactive management. You can set up smart alerts that warn you when a certain threshold is crossed.
- Overstocking alert: You receive a notification if a product’s turnover ratio drops dangerously. It’s the signal to launch a promotion before it becomes dead weight.
- Stockout risk alert: If sales of an item start surging, the system suggests placing an order to anticipate demand and avoid disappointing your customers.
For this kind of inventory management to be truly effective, the reliability and speed of database solutions are essential, since they allow all this information to be processed in real time.
The concrete benefits of automation
Switching to an automated system to track your stock turnover isn’t just a nice-to-have gadget. It’s a strategic investment with very concrete returns.
- Precious time saved: The hours spent tinkering with figures in Excel are reinvested in strategic analysis and growing your business.
- Finally reliable data: By eliminating manual errors, you make decisions based on an accurate, faithful picture of your performance.
- Faster, better-informed decisions: With always up-to-date reports, you can react immediately to market trends, adjust your orders, and optimize your cash flow without delay.
In short, automation puts you back in control. You no longer endure the complexity of your financial management — you master it. To go further and see how these tools can transform other facets of your business, check out our complete guide to business process automation.
Frequently asked questions about inventory turnover
Even after breaking down the calculation and the strategies, some practical questions often remain. That’s completely normal. The idea here is to answer the most common questions from online sellers clearly and directly, so you have a complete grasp of the topic.
What’s the difference between turnover ratio and days of inventory?
These two concepts are often confused, even though they’re simply two sides of the same coin. They measure the same thing, but one speaks of speed, the other of duration.
Imagine you’re on a road trip:
- The inventory turnover ratio is your speed in km/h. It tells you how many times your stock was fully sold and replenished over a given period. A ratio of 12 means you emptied and refilled your shelves 12 times over the year.
- Days of inventory (or inventory coverage) is the time it takes you to reach your destination. It measures how many days you can hold out with your current stock. A coverage of 30 days means you have one month of autonomy before your next delivery.
The relationship between the two is very simple: Coverage (in days) = 365 / Turnover ratio. The turnover ratio gives you an overall view of your performance, while coverage is an operational tool, essential day-to-day for planning restocks and avoiding stockouts.
Is a very high turnover ratio always a good thing?
Not necessarily. It’s a classic trap to believe that “higher is always better.” A turnover ratio through the roof might seem great, suggesting crazy demand for your products. But be careful — an extreme figure can also hide real problems.
An abnormally high ratio often means you’re constantly walking a tightrope, on the verge of a stockout.
An optimal turnover ratio isn’t the highest possible one. It’s the one that finds the perfect balance between meeting customer demand and securing your supply, all without draining your cash flow.
The consequences of chronic understocking can really hurt:
- Lost sales: A customer who finds a product unavailable will go elsewhere. That’s a sale going straight to a competitor.
- Frustrated customers: Repeated stockouts end up eroding your customers’ trust and loyalty.
- Skyrocketing logistics costs: You’re forced to place lots of small emergency orders, which drives up your shipping costs and the workload to manage them.
The goal, then, is to aim for a healthy, balanced rate for your industry, not to break records that would put your entire supply chain under unbearable strain.
How should you manage turnover for seasonal products?
Calculating an annual inventory turnover ratio for products like Christmas decorations or swimsuits is a mistake that can cost you dearly. The resulting figure would be very low and wouldn’t reflect at all how the product performs when it’s actually in demand.
For this type of item, the analysis needs to be much more targeted. The right approach is to calculate the ratio only over the peak season.
For example, for ski equipment, you’d analyze the period from November to March. This will give you an accurate, precise picture of how fast these products actually move when customers are looking for them.
The strategy for these products is also quite specific:
- Refined forecasting: Rely on sales data from past seasons to anticipate your needs.
- Staggered orders: Rather than one massive order, plan several deliveries. This will let you adjust your stock levels based on early sales trends.
- Planned clearance: The goal is to end the season with stock close to zero. Prepare end-of-season promotions to clear out the last pieces and avoid storing unsold items for months.
This near-surgical approach lets you maximize profits during peak season while minimizing the costs tied to products that would otherwise sit dormant in your warehouse until the following year.
By applying these strategies and closely tracking your indicators, you transform your inventory management. From a cost center, it becomes a genuine profitability engine. To go further and automate this steering, Bizyness centralizes your sales and inventory data to give you a clear, real-time view of your performance.
Discover how Bizyness can simplify your financial management
