

 Français
 Mastering the income statement in 3 steps
Discover how to effectively analyze the income statement to improve your company's financial performance.

The fundamentals of the income statement
The income statement, also called the profit and loss statement, is an essential accounting document for any business. It provides an overview of financial performance over a given period, usually a year. It summarizes income (revenue, other earnings) and expenses (purchase costs, salaries, rent) to determine the net result, i.e. the profit or loss. This statement is a crucial decision-making tool, well beyond its simple legal obligation.
Understanding the structure of the statement
The income statement is structured precisely, in line with the French General Chart of Accounts (Plan Comptable Général, PCG). It breaks down into several result levels, allowing a progressive analysis of profitability. To deepen your knowledge of digital project management, feel free to check out online resources such as those offered by Noxcod: Digital project manager guide: strategies, methods & results.
-
Operating income: Revenue generated by the company’s main activity (sales of goods or services).
-
Operating expenses: Costs directly related to the activity (raw material purchases, salaries, social contributions).
-
Operating result: Difference between operating income and operating expenses. Key indicator of the profitability of the core activity.
-
Financial result: Financial income and expenses (loan interest, investment income).
-
Exceptional result: Exceptional income and expenses (capital gains on asset disposals, insurance payouts).
-
Net result: Final result after corporate income tax. Represents the profit or loss for the period.
Different possible presentations
The income statement can be presented as a list or as a table. The list format is more concise, while the table format offers better readability and makes comparisons easier. The choice depends on the company’s needs.
The importance of analyzing the statement
Analyzing the income statement helps decode the company’s performance drivers. Trends in income, expenses, and the various result levels highlight the company’s strengths and weaknesses. A decline in operating result, for example, can signal rising costs or falling sales.

Comparison with competitors and industry data is also essential. In 2022, the gross operating surplus of non-agricultural, non-financial market businesses in France reached €86.2 billion according to Insee. This kind of comparative analysis helps position the company’s performance in the market and identify areas for improvement. Mastering the income statement is therefore fundamental to steering your business and making informed strategic decisions.
The complete anatomy of an income statement that speaks for itself

An income statement is much more than a simple accounting obligation. It is a powerful tool for analyzing a company’s financial health and anticipating its future. It traces the journey of the business, from revenue generation to profit, or loss.
Operating income: the source of revenue
The income statement begins with operating income. This section reflects the company’s business model and details the origin of its revenue. Does it come from selling products, providing services, or both? Analyzing this section helps identify the main sources of revenue and how they evolve. Understanding this dynamic is essential to adapting business strategy.
Operating expenses: keeping costs under control
Operating expenses cover all the costs needed to generate operating income. Raw material purchases, salaries, rent, and social contributions are part of it. A precise analysis of these expenses is essential to identify the largest spending items and optimize costs. A disproportionate rise in expenses relative to income can signal a management problem affecting profitability.
Intermediate management balances: key performance indicators
To assess performance, intermediate balances are calculated. Gross operating surplus (EBE), obtained by subtracting certain operating expenses from operating income, is a key indicator of the profitability of the core activity. It measures the company’s ability to create wealth before accounting for depreciation, provisions, and financial expenses. The operating result, on the other hand, includes these elements and provides a more complete view of economic performance. These balances are important signals for executives, allowing them to quickly spot a decline in margins or drift in the cost structure.
Before presenting the income statement, here is a brief overview of its usefulness: it helps summarize the various components of the income statement, their definitions, and their calculation methods, providing a better understanding of a company’s financial performance.
| Item | Definition | Calculation method | Analytical importance |
|---|---|---|---|
| Operating income | Revenue generated by the core activity | Sales of goods or services | Assesses the level of activity and commercial performance |
| Operating expenses | Costs directly related to the core activity | Purchases, salaries, rent, etc. | Measures the effectiveness of cost management |
| Gross Operating Surplus (EBE) | Gross margin after deducting operating expenses | Operating income - Operating expenses | Indicates the profitability of the core activity before exceptional items |
| Operating result | Profit generated by the core activity after accounting for all operating costs, including depreciation and provisions | EBE - Depreciation and provision allowances + Depreciation and provision reversals | Measures the overall performance of the core activity |
This table summarizes the main elements of the income statement. Analyzing these items helps assess a company’s financial performance and understand the drivers of its profitability.
In-depth analysis: an asset for decision-making
Experienced executives use the income statement as a genuine strategic tool. They analyze each component to identify trends, weaknesses, and opportunities for improvement. This analysis, combined with knowledge of the industry, helps anticipate difficulties, seize opportunities, and make informed decisions to optimize financial performance. The income statement thus becomes an essential tool for steering the company toward success.
Telltale indicators of your financial health

Once drawn up, the income statement becomes a valuable tool for analyzing your company’s financial health. It allows you to calculate financial indicators, also known as ratios, which provide a relevant summary of the data. These ratios turn raw figures into actionable information for steering the business and making decisions.
Gross trading margin: a key indicator for trading companies
The gross trading margin is an essential indicator for companies that sell goods. It reflects the profitability of sales and is calculated by dividing the trading margin by revenue excluding tax. A high rate indicates a substantial margin on sales. This ratio helps assess the effectiveness of pricing policy and purchasing performance.
Gross margin rate: measuring the overall profitability of the business
Beyond trading margin, the gross margin rate offers a more comprehensive view of profitability. It takes into account the production cost of the goods or services sold. Calculated by dividing gross margin by revenue, this ratio helps analyze company performance after deducting these costs. Regular monitoring of this indicator makes it possible to quickly spot any decline in profitability.
Net profitability: the ultimate indicator of financial performance
Net profitability, often expressed as a percentage, is the final indicator of a company’s financial performance. Obtained by dividing net result by revenue, it represents the share of revenue that remains after deducting all expenses, including tax. High net profitability reflects good financial health and effective management.
Comparing to better understand: the importance of context
Analysis of financial indicators must always be put in context. It is essential to compare your own ratios with those of companies in the same industry, taking size and stage of development into account. A start-up, for example, may have negative net profitability early in its activity without this being alarming. What matters is tracking how indicators evolve over time.
Industry analysis of income statements can reveal significant disparities. For example, in 2021, the manufacturing industry (sector C) had payroll costs representing between 30% and 60% of value added depending on the sub-sector. This directly affected operating margin, which ranged from 5% to 15% depending on the segment. INSEE statistics offer further information on this topic. Tools such as Bizyness make it easy to generate and track these indicators for a better understanding of how your financial performance is evolving. A relevant analysis of these ratios will help you make informed decisions to improve profitability and ensure the sustainability of your business.
Sector breakdown: understanding your positioning
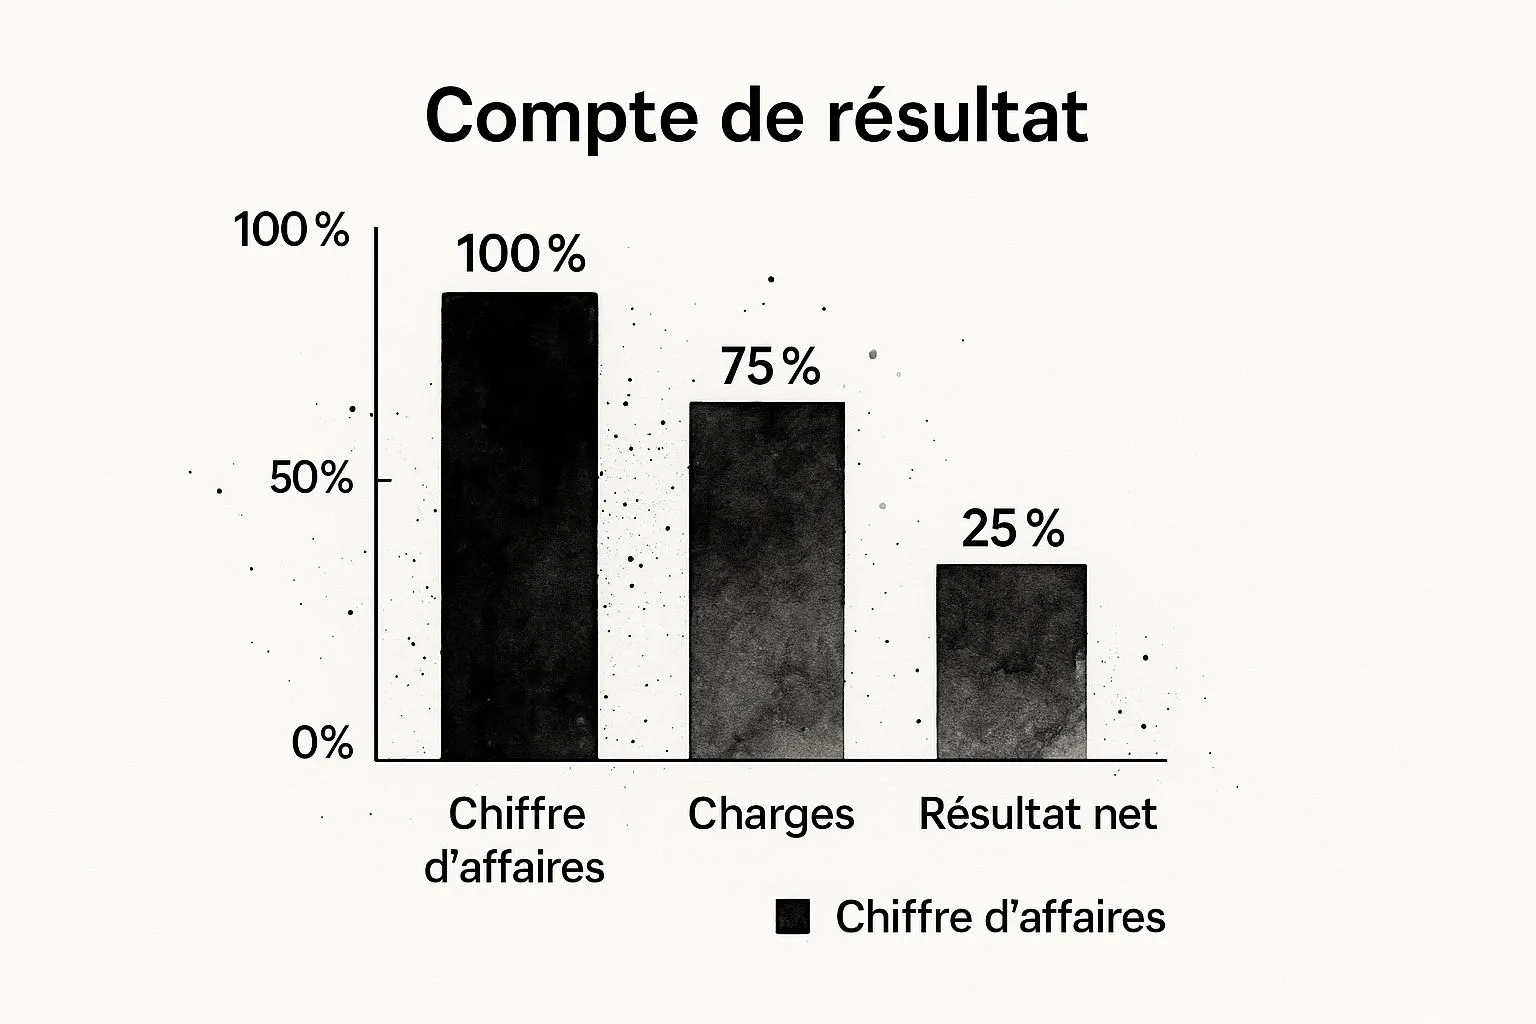
The chart above shows margins and personnel costs for three sectors. Your income statement takes on its full meaning when compared with those of companies in your industry. This industry benchmark is essential for understanding your positioning and identifying areas for improvement. An excellent margin rate in one sector may be insufficient in another. This chart highlights the disparities between sectors.
The importance of benchmarking
Comparing your income statement to your industry benchmark lets you identify your strengths and weaknesses. Are your margins above or below average? Are your expenses optimized? This benchmark also helps you spot performance drivers. What practices do top-performing companies in your industry follow?
By analyzing this data, you can adapt your strategy. How can you adjust your prices, costs, or investments to improve your profitability?
Characteristics of each sector
Every industry has its own financial characteristics. For example, large-scale retail is characterized by high volumes and low margins. Intellectual services, on the other hand, generally have lower volumes but higher margins.
It is therefore essential to compare your performance to that of similar companies.
To illustrate these differences, let’s look at margins and personnel costs across three sectors.
Here is a comparative table to better visualize this data:
Comparison of income statement structures by sector
Comparative analysis of key financial ratios and cost structures by industry
| Sector | Average gross margin | Share of personnel costs | Operating profitability | Characteristics |
|---|---|---|---|---|
| Large-scale retail | 15% | 10% | Low | High volumes, strong competition |
| Industry | 25% | 20% | Medium | Heavy investments, long cycles |
| Intellectual services | 40% | 50% | High | Reliance on skills, hourly billing |
This table summarizes the main differences between these three sectors. Large-scale retail, with its low margins, must optimize its costs. Industry, with its heavy investments, aims for stable profitability. Intellectual services, despite high personnel costs, benefit from strong margins.
Adapting your strategy with Bizyness
Bizyness lets you generate and analyze your income statement. By comparing your data with that of your industry, you’ll identify areas for improvement and adapt your financial strategy to optimize performance.
Anticipating market changes
Industry analysis helps anticipate market changes. Watching the trends in your sector’s ratios will help you spot early warning signals. For example, a general decline in margins may indicate increased competitive pressure or changing consumption habits. Staying alert to these signals will let you anticipate change and stay competitive.
The tax impact: optimizing without taking risks
Taxation is a key element to consider when analyzing an income statement. It directly impacts net profit and can influence how a company’s performance is interpreted. Understanding the French tax system is therefore essential to optimizing your financial strategy.
Taxes and the income statement
Several taxes in France directly affect the income statement. Take corporate income tax (IS): calculated on taxable income, it reduces net profit. Other taxes, such as the corporate property tax (CFE), are recorded as operating expenses and therefore change the operating result. Mastering these various mechanisms is essential for effective financial management.
Tax optimization: legally reducing the burden
There are legal solutions for optimizing your tax burden and, as a result, improving your net result. For example, certain items on the income statement, such as depreciation, help reduce the corporate tax base. In addition, schemes such as the research tax credit (CIR) encourage companies to invest in innovation. This credit, which benefited 36,000 companies in 2021, represents a tax reduction of up to 30% of R&D spending. The Île-de-France region alone accounted for nearly 40% of the total CIR amount in 2020. To learn more about the CIR and its impact on the income statement, see this link. These tax levers can greatly improve project profitability.
The importance of tax strategy
Adopting a tax strategy is essential to optimizing financial performance. Companies need to identify the tax schemes best suited to their situation and integrate them into their overall strategy. This not only reduces the tax burden but also keeps the company compliant with legislation. Tools such as Bizyness offer features that simplify managing tax matters, allowing entrepreneurs to focus on their core business.
Examples of tax optimization
Imagine a company investing in research and development. The CIR allows it to reduce its corporate tax and thus increase its net profit. Another company might optimize its cost structure by favoring equipment rental over purchase, influencing its depreciation and tax burden.
Bizyness: a tool for tax management
With Bizyness, simplify the management of your tax obligations and optimize your income statement. The app makes it easy to manage VAT, create tax reports, and automate transactions, letting you focus on growing your business. By combining a good understanding of tax mechanisms with powerful tools like Bizyness, you can improve your net result and contribute to your company’s success.
The digital tools transforming financial analysis
Analyzing an income statement is essential to understanding a company’s financial health. Fortunately, today many digital tools go well beyond traditional spreadsheets, offering in-depth analysis, clear visualizations, and valuable automation.
Solutions for SMEs: Sage and EBP
Management software such as Sage and EBP offer comprehensive solutions for the accounting and financial management of SMEs. They make it possible to automatically generate income statements, calculate key indicators, and track performance trends over time. Relatively affordable in terms of cost, these tools simplify day-to-day management and provide a clear overview of the financial situation. For example, Sage offers features for asset management, invoicing, and payment tracking — all essential elements for building the income statement.
Financial analysis platforms: optimized steering
For companies with more complex needs, financial analysis platforms such as Bizyness offer more advanced features. Automating repetitive tasks, such as data collection and consolidation, frees up time for analysis and decision-making. These platforms offer dynamic, customizable dashboards, allowing you to view financial data from different angles.
Predictive AI: anticipating the future
The integration of artificial intelligence (AI) into some platforms takes things even further by offering predictive analysis. Based on historical data and market trends, AI can anticipate how revenue, expenses, and ultimately results will evolve. These forecasts help executives make proactive decisions and optimize their strategy. AI can, for example, identify potential risks, such as declining profitability, and propose solutions to minimize them.
Usage examples
Consider an e-commerce business using a financial analysis platform. It can track sales trends in real time, identify its top-performing products, and optimize its marketing campaigns. In the industrial sector, predictive AI can help anticipate the impact of raw material cost fluctuations on operating result.
Costs and benefits
Investment in a digital tool depends on the needs and size of the company. Simple solutions are available from a few tens of euros per month, while more comprehensive platforms can represent an annual investment of several hundred, or even thousands, of euros. However, the benefits are generally significant: time savings, better decision-making, cost optimization, and improved profitability. These tools turn income statement analysis into a genuine performance lever.
Testimonials
Many entrepreneurs highlight the positive impact of digital tools on their financial management. They appreciate the simplification of accounting tasks, the clarity of dashboards, and the ability to anticipate market fluctuations. These tools let them focus on their core business and manage their company with greater peace of mind.
