

 Français
How to Read a Balance Sheet Easily
Learn how to read a balance sheet. Our guide shows you how to analyze assets, liabilities, and your company's financial health.

Learning to read a balance sheet is a bit like learning a new language: at first it seems complex, but once you grasp the basic logic, everything becomes clear. The golden rule is the perfect balance between assets (what the company owns) and liabilities (how it’s all financed). Once you understand this duality, the balance sheet stops being a mere administrative document and becomes a real compass for your decisions.
Breaking down the balance sheet to truly understand your business

Don’t think of the balance sheet as just a legal obligation. Above all, it’s a snapshot of your company’s financial health at a specific point in time. It sets out, in black and white, what your company owns (its assets) and how it financed those acquisitions (its liabilities). These two columns are truly the pillars of the entire analysis.
On one side, assets list all the property and rights of your company. Think of your machinery, premises, inventory, but also receivables — the money your customers owe you. This is where your resources are put to use.
On the other side, liabilities tell us where those resources came from. Here you’ll find equity (money contributed by shareholders plus accumulated profits) and, of course, debts owed to third parties, such as bank loans or supplier invoices to be paid.
Why assets must always equal liabilities
This famous rule, Assets = Liabilities, isn’t a coincidence or an accounting trick. It reflects a simple economic reality: every euro you own (an asset) had to come from somewhere (a liability).
Let’s take a concrete example. You decide to invest in a new machine worth €10,000. This machine increases your assets. To pay for it, there are two scenarios:
- You use the company’s cash reserves: your equity (on the liabilities side) finances the purchase, and the machine replaces the cash (on the assets side). The balance is maintained.
- You take out a bank loan: your debt (on the liabilities side) increases by €10,000, which offsets the increase in your assets.
This balance is fundamental, as it reveals the stability of your financial structure. Liabilities that lean heavily toward debt can signal a certain fragility. Conversely, solid equity is a sign of strength and independence.
For a business owner, understanding this balance isn’t just a technical matter — it’s purely strategic. It’s what lets you assess your company’s capacity to invest, absorb hard knocks and, above all, reassure your financial partners.
To help you visualize this, here’s a very simplified structure that sums up the essentials.
Simplified structure of a balance sheet
| Balance Sheet Column | What it represents | Concrete examples |
|---|---|---|
| Assets | Uses: what the company owns and uses. | Machinery, inventory, customer receivables, cash. |
| Liabilities | Resources: where the money financing the assets comes from. | Equity, bank loans, supplier debts. |
This table highlights the use-resource duality, which is the cornerstone of the entire balance sheet.
A major asset for steering your business
Knowing how to read your balance sheet is a huge advantage in the field. In France, with nearly 4 million active companies, the ability to decode your own accounts is a real performance factor. In fact, studies show that business owners who master their financial statements achieve an acceptance rate for credit applications that’s 12 points higher. Why? Because an owner who speaks confidently about fixed assets or equity immediately inspires trust. If you’d like to dig deeper, feel free to check out our full guide on analyzing a balance sheet.
Yet the reality is more nuanced: nearly 45% of French SMEs admit they struggle to interpret their accounts, which highlights a real need for skill-building. In a competitive environment, understanding your balance sheet isn’t optional — it’s a performance lever. For more details on these figures, analyses from the Banque de France are an excellent resource.
Let’s now dive into the first major column of the balance sheet: assets. At first glance, you might think it’s simply a list of what a company owns. But in reality, it’s much more than that. It’s the concrete reflection of your strategy, your investments and the way you run the business day to day.
To truly know how to read a balance sheet, you need to learn to decode the story hidden behind these lines.
Assets are divided into two worlds that coexist but move on very different timescales. On one side, there’s what you own to last. On the other, what moves and transforms constantly to generate revenue.
Fixed assets: the foundation of your business
Here we’re talking about the assets of your business — investments made to serve the company over the long term (more than a year). These aren’t goods you plan to sell tomorrow morning; they’re the foundations on which your entire capacity to create value rests.
Fixed assets are generally divided into three main families:
- Tangible fixed assets: Everything that’s physical, that you can touch. Think of your computers, production machinery, vehicle fleet, or even your office walls if you own them.
- Intangible fixed assets: These have no physical form, but their value can be immense. Examples include a patent, the value of your business goodwill, a trademark you’ve registered, or specific software you’ve acquired.
- Financial fixed assets: These are your long-term investments. They can be shares you hold in a subsidiary or another company (known as equity investments) or security deposits paid out.
Looking closely at this section tells you a lot about the company’s underlying strategy. Heavy fixed assets are perfectly normal for a factory, whereas they’ll logically be much lighter for a consulting firm that mainly sells time and expertise.
Current assets: the day-to-day engine of your business
By contrast, current assets bring together everything in constant motion, in step with your operating cycle. Their purpose is to be converted into cash fairly quickly, generally within a year. This is where you take the pulse of your business.
Its main components are:
- Inventory: Whether it’s merchandise for resale, raw materials to be transformed, or finished products ready to ship, this is everything sitting in your warehouse.
- Customer receivables: Quite simply, the money your customers owe you. You’ve made the sale, delivered the product or service, but haven’t been paid yet.
- Cash: The lifeblood! This is money immediately available, whether in your bank accounts or your till.
The structure of these current assets is an excellent barometer of your operational performance. It shows whether you’re efficient at turning your business into cash.
A key concept to remember: liquidity. This is the ease with which an asset can be converted into cash. On the balance sheet, assets are always ranked in order of increasing liquidity: starting with fixed assets (the least liquid) and ending with cash (the most liquid asset of all).
Concrete scenarios: what assets really tell you
To make this more tangible, let’s take two examples. Imagine an e-commerce store owner who sees their product inventory double in six months. If sales haven’t followed the same curve, that’s a warning sign. It could mean they’re piling up unsold stock gathering dust on the shelves — and, above all, tying up cash that could be used elsewhere.
Another case: a freelance consultant notices that “customer receivables” is exploding. Even if revenue looks excellent on paper, this could potentially be bad news. It means customers are slow to pay. If not careful, they could find themselves in a cash-flow bind, unable to pay their own expenses. Analyzing assets is therefore not a mere accounting exercise — it’s a real management tool.
Interpreting liabilities and equity

Now that we’ve seen where the company’s money goes with assets, let’s look at an equally fundamental question: where does that money come from? That’s the whole point of liabilities. This part of the balance sheet is a true indicator of your company’s dependence on its partners, whether shareholders, banks, or even suppliers.
To properly read a balance sheet, you need to see liabilities as the map of your financial structure. It breaks down into two major groups that tell very different stories: the company’s real wealth (equity) and what it owes to third parties (debts). Understanding their balance is absolutely crucial to assessing the soundness and sustainability of your business.
Equity, the real safety cushion
Equity is simple: it’s the share of resources that truly belongs to the company and its shareholders. It’s your safety cushion, the first line of defense in a rough patch. The stronger it is, the more your company is seen as self-sufficient and stable.
Concretely, it consists of three key elements:
- Share capital: The starting stake. The contributions founders or investors injected at creation to get things going.
- Reserves: This is essentially the company’s savings. It consists of past years’ profits that weren’t distributed as dividends but kept to strengthen the financial structure.
- Net income for the period: This is the performance of the year that just ended. A profit boosts equity, while a loss erodes it.
Solid equity is an extremely powerful trust signal for bankers and investors. It proves your company can finance part of its growth on its own and has a strong enough backbone to absorb the unexpected without rushing to seek external financing every time.
An absolute point of vigilance: negative equity. This is a bright red warning light. It means accumulated losses have eaten through all the starting capital and then some. The company then has more debt than value. Legally, this is a situation that can lead to dissolution if not corrected quickly.
Debts: external resources to keep under control
Opposite equity, we find debts. For many companies, they’re an essential growth lever, but their weight must be watched like a hawk. They’re generally distinguished by their repayment horizon.
Here’s a simple but effective distinction:
- Long-term debts: Mainly large bank or bond loans taken out to finance structural investments, such as a new machine or the purchase of your premises. Their repayment is logically spread over several years.
- Short-term debts: Often called operating debts, they’re part of daily life. These include supplier invoices still to be settled, VAT or corporate tax due, and social security contributions to be paid.
Analyzing the structure of your debts is essential. Imagine a company financing a machine (a long-term asset) with a bank overdraft (short-term debt). That’s the surest way to put yourself in danger. The golden rule is to match the duration of your financing to the lifespan of what it’s financing.
Ultimately, analyzing liabilities means judging the balance between financial independence and debt. A company with 80% debt for just 20% equity is walking a tightrope. It’s at the mercy of its creditors. At the slightest slowdown in activity, it will be far more fragile than a company with better-balanced liabilities.
Bring the numbers to life with ratios
A balance sheet, taken as is, is a photograph. It’s a snapshot of your company’s situation at a given moment. Interesting, certainly, but a bit static. To really understand the dynamics, to see the movie of your business, you need to make these numbers talk to each other. That’s the whole art and value of ratios. They turn raw data into real performance indicators.
No need to get lost in a jungle of complex formulas. In reality, a handful of key ratios is enough to move from a simple reading to a truly strategic analysis. Let’s focus on the ones that really matter day to day.
The Net Working Capital (NWC): the basis of your balance
The first thing to check is the Net Working Capital (NWC). Its role? To verify that your long-term investments (machinery, premises, etc. — what’s called fixed assets) are properly financed by resources that last, namely your equity and long-term debts. It’s simply common sense.
If your NWC is positive, breathe easy: that’s an excellent sign. It means not only do your stable resources cover your investments, but there’s even a surplus left over. This surplus isn’t a luxury — it’s vital. It’s what will help you finance your business’s day-to-day needs.
Think of NWC as your company’s safety cushion. A positive, stable NWC year after year is proof of a healthy financial structure. You’re not financing your long-term investments with short-term credit, a practice as common as it is perilous.
Working Capital Requirement (WCR): the nerve center of operations
The Working Capital Requirement (WCR) is arguably the most concrete indicator, the one that speaks most directly to a business owner. It simply measures the cash-flow gap generated by your day-to-day activity. Put simply, it’s the money you have to advance to finance your inventory and wait for customers to pay you, even before you’ve paid your own suppliers.
The formula is straightforward: WCR = Inventory + Customer receivables − Supplier debts.
- A positive WCR is the most common situation, especially in trade or industry. You need financial “fuel” to keep the machine running.
- A negative WCR is the holy grail (typical of large-scale retail). You collect money from your customers before having to pay your suppliers. A very comfortable position!
Keep a constant eye on your WCR. A sudden increase, even with a full order book, can drain your cash at an alarming rate. If you want to dig into how to calculate it, our guide on how to prepare a balance sheet will give you concrete pointers.
The debt ratio: a barometer of your independence
Finally, the net debt ratio is essential to know how much you’re truly in control. It weighs your financial debts against your equity. The logic is simple: Debt ratio = Net debt / Equity.
This indicator tells you whether your company “belongs” more to its shareholders (you) or to its bankers.
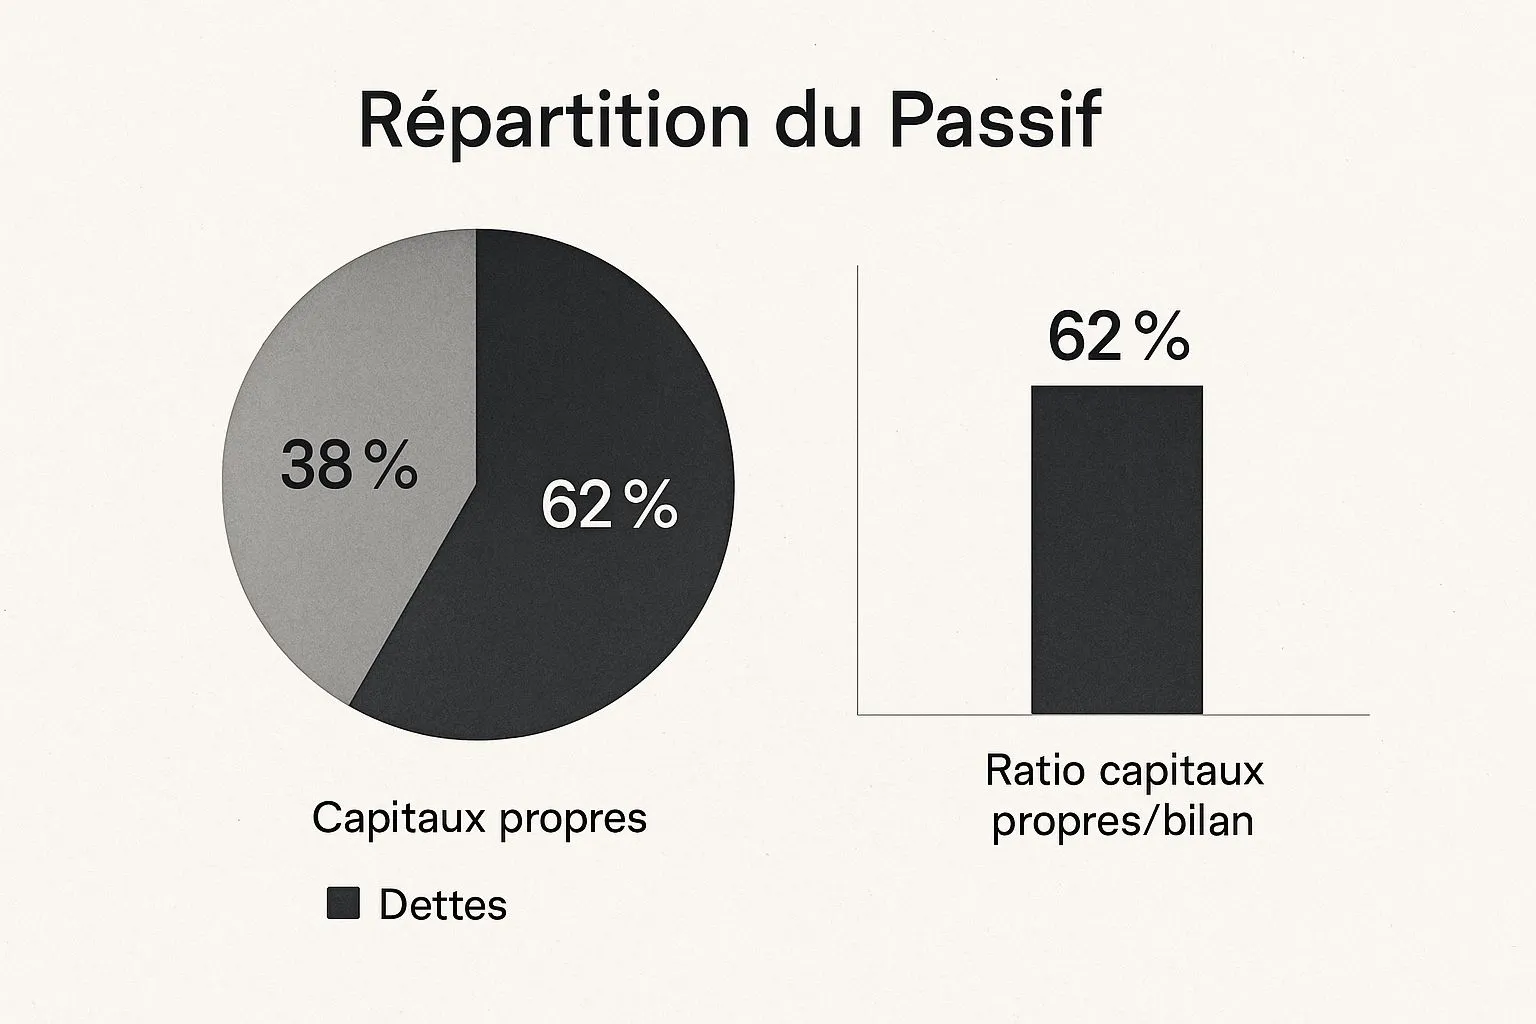
This visual shows a healthy structure where equity (at 62%) far outweighs debt (at 38%). This is the kind of balance that reassures everyone.
In general, a ratio below 1 (or 100%) is considered a good sign. It means you have more equity than debt, a strong argument when facing a banker or investor. Beyond that, caution is warranted. An excessively high ratio is a sign of fragility: your company becomes too dependent on its creditors.
To help you see things more clearly, here’s a summary table of the most common financial ratios and what they teach you about your business.
Essential financial ratios and their interpretation
This table gives you an overview of the main ratios, how to calculate them, and what they reveal about the company’s health.
| Financial ratio | Simplified calculation formula | What it means for your business |
|---|---|---|
| Net Working Capital (NWC) | Permanent capital – Fixed assets | Indicates whether your stable resources properly finance your long-term investments. A positive NWC is a sign of good structural health. |
| Working Capital Requirement (WCR) | Inventory + Customer receivables – Supplier debts | Measures the financing need generated by your operating cycle. It’s a key indicator of your cash management. |
| Net debt ratio | Net debt / Equity | Assesses your level of financial dependence. A ratio below 100% is generally a good signal for lenders and investors. |
| Current ratio | Current assets / Short-term debts | Shows your ability to meet short-term debts with your short-term assets. A ratio above 1 is reassuring. |
Analyzing these few ratios will give you a much more dynamic and relevant view than simply reading the raw amounts on the balance sheet. It’s an exercise that turns accounting from a constraint into a real management tool.
Adapting to the new French Chart of Accounts standards
In France, the way balance sheets are read is about to change radically. A major reform of the French Chart of Accounts (Plan Comptable Général) is underway, and it will modernize the presentation of accounts. It’s best to understand these changes so you’re not caught off guard.
Far from being a mere technical update, this reform responds to a pressing need for clarity and simplicity, especially for small and medium-sized businesses. The idea is to make balance sheets easier to digest and to allow fairer comparisons between companies.
Why these changes now?
Get ready: starting January 1, 2025, reading a balance sheet in France will no longer be quite the same. This change is driven by the French Accounting Standards Authority (ANC — Autorité des Normes Comptables) with a clear mission: simplify and make financial information more transparent. Until the end of 2024, the complexity of some balance sheets could really be a barrier to analysis. The new standard imposes much more readable formats.
This standardization is excellent news, especially for SMEs which, let’s remember, make up 99% of the French economic fabric. Some accounts are simply merged or removed. The result? A leaner balance sheet structure and an analysis that becomes far more intuitive. To prepare properly, it may be worth learning about the concrete impacts of this reform.
What actually changes for you
Beyond the theory, these adjustments will directly impact how you comment on a balance sheet. The new presentation was designed to be more intuitive. For example, the disappearance of expense transfers will greatly simplify the income statement. As a result, this will make it easier to analyze net income, which feeds into equity on the balance sheet.
And that’s not all. The structure of the notes — that famous document accompanying the balance sheet that can sometimes seem endless — is also being standardized. No more sprawling, hard-to-decipher notes. Precise, now-mandatory tables will let you find essential information at a glance, such as the breakdown of debts or fixed assets.
The goal is clear: to let you focus on pure financial analysis rather than getting lost in the complexity of the standards. It’s a major step toward greater transparency.
Anticipating these changes will give you a real advantage, whether in your exchanges with your accountant or when presenting your figures to partners. Understanding these new rules isn’t optional — it’s an asset for better steering your business.
Your frequently asked questions about reading a balance sheet
The first time you dive into a balance sheet, you quickly get the impression of facing a mountain of numbers. That’s perfectly normal. Let’s demystify together the questions that come up most often, so this document becomes a real management tool for you.
What’s the difference between a balance sheet and an income statement?
This is THE essential question. To put it simply, I like to use a metaphor: the balance sheet is a photograph of your company at a given moment, generally December 31. It shows what you own (assets) and what you owe (liabilities). It’s a frozen image of your net worth.
The income statement, on the other hand, is the movie of your year. It tells the story of your business over the whole period, listing your revenue (income) and your expenses (costs). At the end, it tells you whether you made money (profit) or lost money (loss). One is a snapshot, the other is the narrative of your performance.
Why is equity so important?
Think of equity as your company’s backbone. It’s the money that truly belongs to you, that doesn’t depend on a bank loan or a supplier invoice. It brings together what the shareholders put in at the start, plus the profits that have been kept in the company over the years.
Solid equity is the best sign of financial health you can send out. It reassures everyone: your banker, your suppliers, your future investors. It proves your company has a strong enough backbone to finance its growth and, above all, to absorb hard knocks. It’s often the first thing a financial partner will look at.
What does it mean to have negative equity?
This is a warning sign. Negative equity means accumulated losses have ended up exceeding everything you originally put into the company. Put bluntly, your debts exceed the value of everything you own. The company no longer belongs to itself.
Legally, the situation is serious. If your equity falls below half the share capital, the law requires you to bring shareholders together to decide the company’s future. Without swift action, such as a capital increase to “refloat” the business, dissolution may be on the table. You need to act, and fast.
How often should you analyze your balance sheet?
Of course, the law requires one balance sheet per year. But in the reality on the ground, waiting 12 months to take stock is like driving while only checking the rearview mirror once an hour. That’s far too long.
To really steer your business, you need checkpoints. For most SMEs, a quarterly analysis is a very good rhythm. It lets you keep an eye on your working capital requirement (the famous WCR), spot cash-flow tensions coming, and correct course well before the end of the year.
Don’t let paperwork and administrative management slow you down any longer. With Bizyness, you can automate your invoicing, track your cash in real time, and prepare your balance sheets without pulling your hair out. Discover how to simplify your life at https://www.bizyness.fr.
