

 Français
Sales Performance Indicators: Optimize Your Sales Effectively
Master sales performance indicators to turn your data into success and boost your sales results. Discover how, starting now.

Sales performance indicators are much more than simple numbers. They are the concrete data that measure the effectiveness of your sales strategies and your team’s results. Think of them as the instruments on your dashboard: they tell you whether you’re heading straight for your goals or starting to drift off course.
Why mastering your sales indicators is essential

Running a sales force without clear indicators is a bit like piloting a plane through a storm, without a compass or radar. You’re moving forward, sure, but with no idea of your heading, your altitude, or the obstacles ahead. Sales performance indicators, often called KPIs (Key Performance Indicators), are precisely your navigation instruments.
Thanks to them, a flood of raw data becomes ready-to-use strategic information. You no longer navigate by instinct; you make informed decisions based on tangible facts. In a market as competitive as ours, this approach has become a matter of survival and growth.
Aligning teams around clear goals
When every salesperson understands exactly which metrics define success, alignment happens naturally. Goals are no longer vague concepts but concrete numbers the whole team collectively works toward.
Take “average order value,” for example. If it’s one of your flagship indicators, your salespeople will know it’s not just about closing a sale, but also about finding opportunities for upselling or cross-selling. This fosters a genuine performance culture where everyone sees the direct impact of their work on the company’s growth.
Correcting course in real time
The market is constantly moving. A winning strategy today can become obsolete tomorrow. Closely tracking your indicators is your early-warning system for spotting problems before they escalate.
A sales cycle that unexpectedly lengthens? It might signal a new customer objection your team doesn’t know how to handle, or a bottleneck in your process. By catching this trend early, you can train your teams or adjust your pitch before your revenue takes a hit.
This agility is key to keeping positive sales momentum. The pressure to deliver results is strong. In fact, facing what’s considered moderate growth, 30% of sales leadership teams anticipate a 5% to 10% increase in their targets. The catch? A third of them doubt their ability to reach those targets, a sign of growing pressure to innovate and optimize every expense. To learn more, check out our analysis of the sales challenges ahead for 2025.
Ultimately, indicators give you the clarity needed to act proactively and turn uncertainty into opportunity.
Breaking performance down into 4 families of indicators
To effectively steer your sales force, the idea isn’t to drown in an ocean of numbers. In reality, not all sales performance indicators carry the same weight or tell the same part of the story. The key is to organize them logically to get a view that is at once global, clear, and above all, actionable.
Imagine you’re building a house. You need separate plans for the foundation, the structure, the electrical wiring, and the plumbing. Each plan is vital, but they don’t address the same need at the same time. It’s exactly the same with your sales indicators. They can be grouped into four major families that, together, paint a complete picture of your performance.
These four families are: activity, efficiency, results, and profitability. Understanding the role of each is fundamental to correctly diagnosing the health of your business and, of course, making the right decisions.
1. Activity indicators: measuring raw effort
Let’s start with the simplest: activity indicators. They’re here to quantify the pure volume of work delivered by your sales teams. Think of it as the number of kilometers a marathon runner covers in training. It measures the effort, but it doesn’t yet say whether they’ll win the race.
These numbers are the foundation of everything. Without activity, there can be no results. It’s as simple as that. They help ensure teams “are actually out in the field.”
A few very concrete examples:
- Number of calls made: The basic indicator for measuring phone prospecting effort.
- Number of emails sent: Helps assess the volume of contacts initiated.
- Number of appointments obtained: A step up, it shows the ability to turn an initial contact into a genuine interaction.
- Number of new opportunities created in the CRM: Crucial for making sure the sales pipeline is constantly being fed.
These indicators form the base of the pyramid. If activity is low, there’s no point looking further for now. The first problem to fix is a lack of action.
2. Efficiency indicators: assessing the quality of work
Measuring effort is good. But working a lot doesn’t mean working smart. That’s where efficiency indicators come in. Their purpose is to assess the quality of the actions taken, often expressed as ratios or conversion rates.
If activity represents quantity, efficiency represents quality. It answers a simple question: “Are our efforts paying off?” It’s the entire difference between running a lot and running fast.
A salesperson might make 100 calls a day (high activity), but if they only land a single appointment (low efficiency), the problem isn’t their workload, it’s their approach, their pitch, or their targeting.
Here are some examples of efficiency indicators to track closely:
- Conversion rate (visitor to lead, lead to customer): This is the king of KPIs. It measures your ability to move a prospect forward through your sales funnel.
- Average sales cycle length: The time it takes to close a deal. If this cycle lengthens, it’s often a sign of friction in your process.
- Closing rate: The percentage of qualified opportunities that turn into signed sales. This is the moment of truth!
The infographic below clearly illustrates how different elements, such as visitor volume or acquisition channels, have a direct impact on the overall conversion rate.
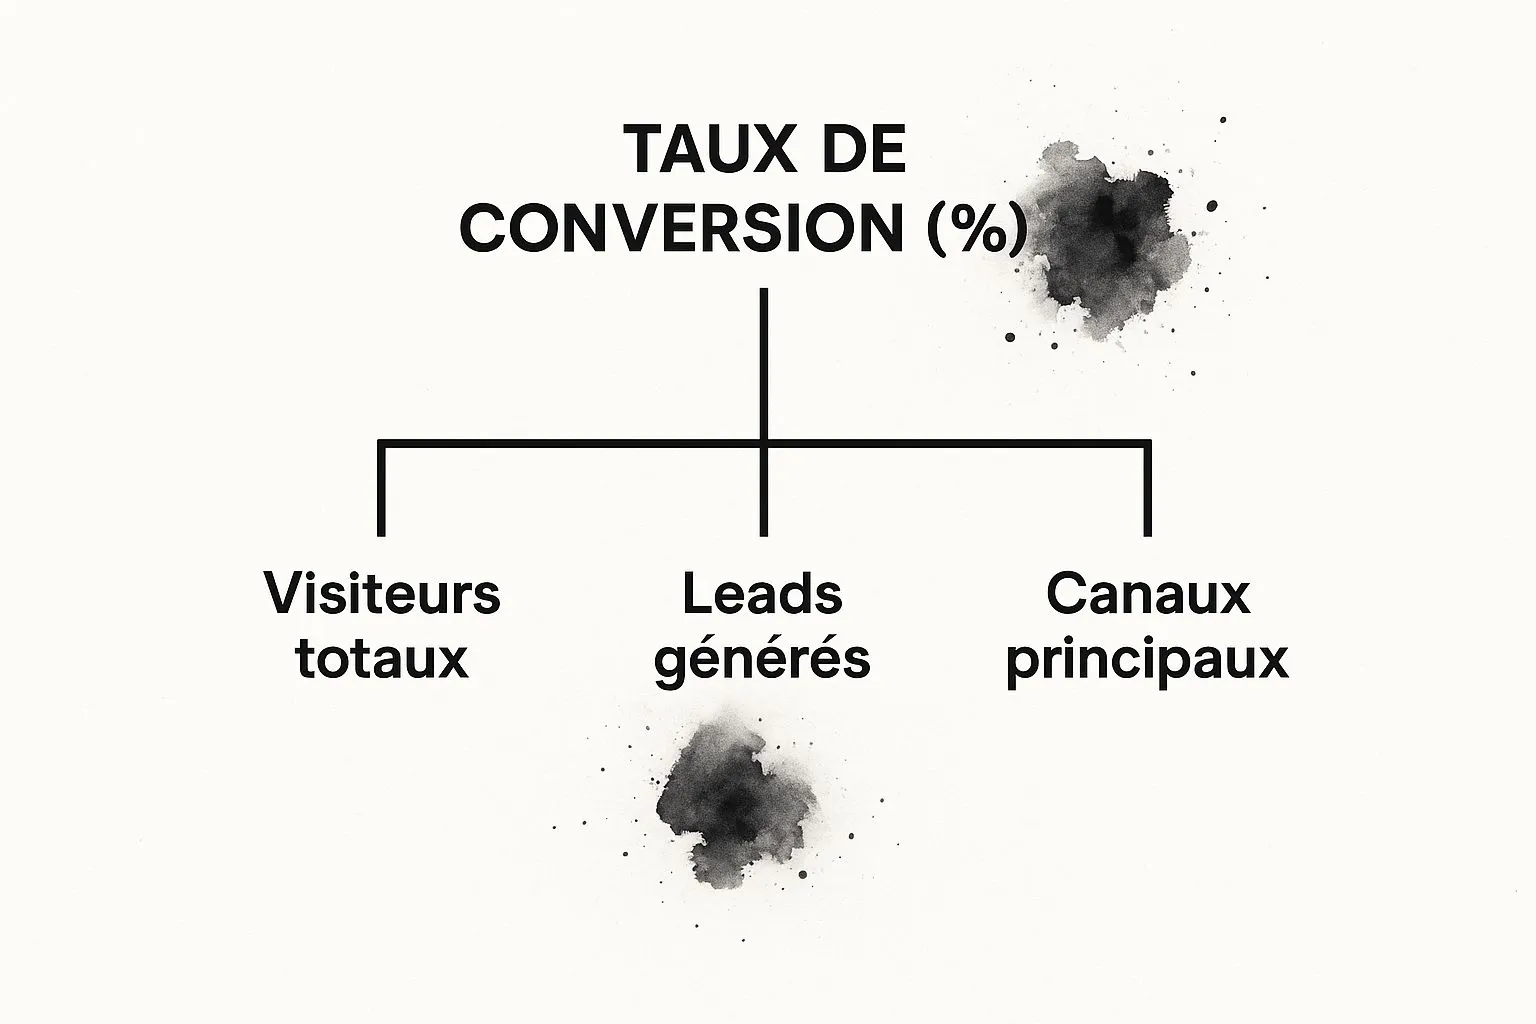
It’s clear that to improve the final conversion rate, you need to act on both the quantity and quality of what enters upstream in the sales funnel.
3. Results indicators: validating the strategy
Results indicators are generally the ones that interest leadership the most. They translate effort (activity) and its quality (efficiency) into concrete numbers that speak to the whole company. These are the ones that ultimately confirm whether the sales strategy is working and whether financial targets are being met.
Here we’re talking about revenue, sales volume, or average order value. These indicators are the logical consequence of the first two families.
4. Profitability indicators: for a long-term view
Finally, the last family of indicators is there to ensure your growth is healthy and sustainable. Selling a lot is great. But selling profitably is even better. These indicators relate the results obtained to the costs that had to be incurred to achieve them.
They include metrics like customer acquisition cost (CAC), gross margin, or customer lifetime value (CLV). Analyzing these numbers protects you from growth at a loss and guarantees the long-term viability of your business model. To broaden your perspective, feel free to check out our guide on company performance indicators, which go beyond the sales-only scope.
By structuring your analysis around these four families, you get a coherent story. You can then precisely identify where your strengths and weaknesses lie, and decide whether you need to “work more” (activity) or “work smarter” (efficiency) to boost your results and profitability.
The results indicators that validate your strategy

If activity and efficiency indicators are the engine of your sales machine, then results indicators are the dashboard. This is where you verify whether all the effort deployed is truly leading somewhere. Unsurprisingly, these are the numbers leadership scrutinizes closely, since they directly translate performance into financial and strategic impact.
But simply collecting them isn’t enough. The challenge is making them speak, to understand what they reveal about the health of your business. These are the sales performance indicators that, ultimately, confirm whether your strategy is paying off.
Revenue and sales volume
Revenue is unquestionably the king indicator. It’s the most direct measure of success, representing the total sum of your sales over a given period. It goes hand in hand with sales volume, which simply corresponds to the total number of units you’ve sold.
These two indicators, however basic, are absolutely fundamental. They offer a snapshot of your sales momentum. Rising revenue is obviously great news, but you should always dig a little deeper. Are you simply selling more products, or have your prices gone up?
This tracking is all the more crucial in a changing economic environment. For example, in the first quarter, revenue for independent retailers in France dropped by an average of 2.20%. This statistic illustrates the importance of monitoring this data to adapt quickly. To learn more about sector-specific dynamics, you can check out this retail activity barometer.
Average order value
Here’s a remarkably effective indicator: average order value. It measures the average amount each customer spends per transaction. The calculation couldn’t be simpler:
Average order value = Total revenue / Number of orders
It’s an excellent gauge of your ability to maximize the value of each interaction. If your average order value stagnates or, worse, declines, it may be a sign that you’re missing out on upselling or cross-selling opportunities.
A rising average order value means your customers are buying more, buying pricier products, or both. It’s a sign of a relevant offer and a sales force that knows how to showcase your entire catalog.
Customer lifetime value (CLV)
Customer lifetime value (CLV) is a more sophisticated indicator, but essential for a long-term view. It’s an estimate of the total profit a single customer will generate for your business throughout their relationship with you. It’s the ultimate measure of customer loyalty and profitability.
To calculate it, you need to combine several key pieces of data:
- Average order value: The amount spent per purchase.
- Purchase frequency: The number of times a customer comes back to buy over a given period.
- Customer lifespan: The average length of time someone remains your customer.
The basic formula looks like this:
CLV = (Average order value × Purchase frequency) × Customer lifespan
Achieving a high CLV is something of a holy grail for any business. It proves you’re not just attracting customers; you know how to retain them and encourage them to spend more over time. A declining CLV is often far more worrying than a one-off dip in revenue, because it strikes at the very heart of your model: your ability to build lasting, profitable relationships.
Optimizing your sales force’s daily work

Financial results are only the tip of the iceberg. They stem directly from the actions your salespeople take in the field, day after day. To truly steer performance, you need to dive into the heart of the machine and focus on the indicators that measure effort (activity) and the quality of that effort (efficiency).
These highly operational sales performance indicators give managers real levers for action. Rather than waiting until the end of the quarter to discover disappointing revenue, they allow you to course-correct almost in real time.
Quantifying effort with activity indicators
Activity indicators are a bit like taking the pulse of your sales team. They measure the raw volume of actions taken to feed the pipeline. It’s simple: without a sufficient level of activity, it’s mathematically impossible to hit your targets.
These numbers answer a fundamental question: “Is my team doing enough?” Here are the most common ones:
- Number of new prospects contacted: This is pure prospecting effort. Calls, emails, social media contacts… it’s the starting point of every sales cycle.
- Number of appointments obtained: This indicator shows a salesperson’s ability to turn a simple initial contact into a genuinely qualified conversation.
- Number of demos performed: For companies selling software or complex products, this is a crucial step that reflects concrete progress in the sales process.
A low activity volume is often the first symptom of a problem. Even before analyzing the quality of the work, you need to make sure the engine is running at full speed.
Assessing quality with efficiency indicators
Working a lot is good. Working smart is much better. Efficiency indicators exist for exactly this: assessing the relevance and impact of the actions taken. They’re often presented as rates or ratios and allow you to pinpoint friction points in your process with great precision.
Think of an activity indicator as the number of arrows shot by an archer. The efficiency indicator is their percentage of bullseyes. You can shoot 100 arrows, but if none hit the target, the problem isn’t the volume, it’s the technique.
By analyzing these numbers, you can pinpoint exactly where your salespeople are losing opportunities.
The conversion rate between each stage
This is the efficiency indicator par excellence. It measures the percentage of prospects who move from one pipeline stage to the next. Analyzing these intermediate rates is absolutely crucial for making a precise diagnosis.
For example:
- A low conversion rate between first contact and appointment may reveal an unconvincing call script or poor initial targeting.
- A low conversion rate between demo and sales proposal may suggest that the demos lack impact or that upstream prospect qualification is insufficient. In short, prospects don’t see the value of your offer.
Average sales cycle length
This indicator measures the average time elapsed between the very first contact with a prospect and the signing of the contract. A lengthening sales cycle is a real warning sign.
It can conceal several problems: a bottleneck in the negotiation phase, overly heavy internal processes (legal review, for instance), or increasingly aggressive competition. The shorter this cycle, the smoother and more profitable your process is. Shortening the average sales cycle length by even a few days can have a huge impact on your annual revenue by speeding up cash inflows.
It’s by optimizing these operational indicators that great sales successes are built.
Building a sales dashboard that truly changes the game
Collecting data is good. But real value emerges when you turn these raw numbers into a clear, intuitive decision-making tool. Your dashboard should be the cockpit of your sales activity, not just a pile of complex data.
The goal isn’t to drown you in an avalanche of numbers. On the contrary, a good dashboard highlights the few sales performance indicators that are truly decisive. It lets you understand, at a glance, what’s working and what’s stuck. It’s the instrument that moves you from analysis to action.
Everything starts with your goals
The first golden rule for an effective dashboard? Start with the end in mind. The fundamental question is: “What specific goal do we want to reach or improve?” This simple question is the cornerstone that will determine which indicators you choose.
For example, if your priority is to shorten your sales cycle, you’ll focus on time spent at each pipeline stage. Is your mission to increase revenue per customer? In that case, average order value and customer lifetime value (CLV) will become your guiding lights.
Without a clear goal, your dashboard will just be a collection of pretty charts with no real use. Every curve, every number should serve a strategic purpose.
Every user, their own indicators
A frontline salesperson and a general manager simply don’t have the same needs. The former needs highly operational data to manage their day, while the latter looks at overall performance and profitability.
A successful dashboard is a personalized dashboard. It should tell a relevant story to whoever is looking at it, filtering out the noise to keep only what matters.
Here’s a logical breakdown for tailoring indicators:
- For the salesperson: Focus on activity and efficiency indicators. Think number of calls, scheduled appointments, opportunity conversion rate, and of course, tracking their own pipeline.
- For the sales manager: The view should broaden. Here you’ll track team goals, each salesperson’s performance, the overall closing rate, and the general health of the sales pipeline.
- For senior management (CEO, CFO): The focus is on financial results and profitability. Revenue, gross margin, customer acquisition cost (CAC), and customer lifetime value (CLV) are the key metrics.
To go further in building this essential tool, feel free to read our complete guide to building a business dashboard that aligns your entire organization.
Bet on visual clarity and real-time data
A dashboard should speak for itself, and quickly. Use simple, universal color codes (green when everything’s fine, red when it’s time to raise the alarm), clean charts, and above all, don’t try to cram everything onto a single screen. The idea is to create a visual experience that makes understanding instant.
Finally, outdated information is worthless. Your dashboard should be connected live to your data sources (your CRM, your invoicing software…) and update in real time. This freshness lets you react not next month, but now. That’s the edge that can make all the difference.
Frequently asked questions about performance indicators
Getting started with tracking sales performance indicators always raises a fair share of very concrete questions. That’s completely normal. It’s not just a matter of numbers in an Excel sheet; choosing and tracking your KPIs touches the heart of strategy, management, and even the company’s tools.
The idea here is simple: answer the most common questions head-on. My goal is to demystify the process and give you the keys to move forward with confidence.
How many indicators should you really track?
This is the big question, and the answer might surprise you: far fewer than you think. The classic trap is wanting to measure everything. You quickly end up drowning in a flood of data that, in the end, isn’t very useful. This is what’s known as “analysis paralysis.”
The golden rule? Favor quality over quantity. To get started, aim for 3 to 5 truly essential indicators per goal or team.
- For a salesperson, the essentials often revolve around their number of appointments, their closing rate, and the revenue they generate.
- A manager will have a broader view: overall team performance, the health of the sales pipeline, and the average sales cycle length.
- Leadership will focus on more strategic indicators such as overall revenue, customer acquisition cost (CAC), or customer lifetime value (LTV).
Keep in mind this phrase often attributed to Peter Drucker: “What gets measured gets improved.” The goal isn’t to measure everything, but to measure what matters for progress.
Start small. Make sure the few numbers you’re tracking are reliable, then add more if needed. The most important thing is that every indicator can trigger a concrete action.
How do you choose the right indicators?
Choosing the right indicators means, above all, making sure they’re perfectly aligned with your goals. A good sales performance indicator should be “SMART”: Specific, Measurable, Achievable, Realistic, and Time-bound.
To gain clarity, ask yourself the right questions, in this order:
- What is our number-one goal this quarter? (For example: Win market share in a new customer segment.)
- What concrete actions will help us reach this goal? (For example: Get more qualified appointments with these specific prospects.)
- How will we know if these actions are working? (For example: By tracking “number of new customers in segment X” and “lead conversion rate for this segment.”)
By making this direct link between goals and KPIs, you ensure they’re real management tools, not just “vanity metrics” — numbers that flatter the ego but don’t help you make decisions.
Should indicators be shared with the whole team?
Transparency is a formidable performance lever, provided it’s used intelligently. Making team indicators public (not necessarily each individual’s personal numbers) offers real benefits:
- Motivation: Healthy emulation can emerge and push salespeople to give their best.
- Alignment: When everyone has their eyes on the same numbers, everyone rows in the same direction. It’s as simple as that.
- Collaboration: A salesperson who excels at one indicator (say, post-demo conversion rate) can share their tips with colleagues.
Be careful, though, not to turn this transparency into a source of stress or judgment. Company culture is key. The idea isn’t to point fingers at those who are struggling, but to create a dynamic where collective wins are celebrated and people help each other overcome obstacles. It’s up to the manager to play the role of coach and run this in a positive way.
What should you do when an indicator turns red?
Seeing a key indicator turn red isn’t a failure. It’s information. It’s actually the whole point of a dashboard: to alert you before the situation becomes critical. The worst thing you could do is ignore the signal.
The right approach happens in three steps:
- Analyze: Don’t stop at the number. Dig to understand the root cause. A closing rate that’s dropping? Is it because of a new competitor, a poorly adjusted price, or a need for training?
- Act: Put a targeted action plan in place. This could be a training session on negotiation, an adjustment to the sales pitch, or something else.
- Track: Measure the impact of your actions on the indicator. Is the curve reversing? Do you need to adjust course?
It’s a continuous improvement loop. For example, if you notice that the average payment delay on your invoices is lengthening (a financial KPI with a direct impact on your cash flow), you need to react quickly. To do so, you might need to review your follow-up process. Feel free to check out our guide on the best way to optimize your invoice payment reminders to quickly turn this indicator around.
To help you overcome the last remaining hurdles, here are a few common questions and answers about setting up and using sales indicators.
Common questions about sales KPIs
Quick answers to help you overcome the obstacles related to setting up and using sales indicators.
| Question | Concise answer | Recommended action |
|---|---|---|
| My CRM is a mess. How do I get reliable data? | Data quality is non-negotiable. Bad data is worse than no data. | Organize a CRM “spring cleaning.” Train the team on simple, clear data-entry rules. Rigor pays off. |
| How do you motivate the team to enter data? | Show them the “Why.” If salespeople see that KPIs help them sell better and reach their goals, they’ll play along. | Share the successes achieved through tracking indicators. Automate data collection as much as possible to make their lives easier. |
| How do you keep KPIs from becoming a surveillance tool? | The manager should position themselves as a coach, not a controller. KPIs are there to help, not to punish. | Use KPIs as a basis for discussion during one-on-ones. Ask: “How can I help you improve this indicator?” |
| The targets seem unattainable, what should we do? | Unrealistic targets are the best way to demotivate a team. They should be ambitious but achievable. | Review the targets with the team. Make sure they’re based on historical data and realistic assumptions. |
These answers should give you a solid foundation. The most important thing is to get started, learn, and continuously adjust. Your performance indicators are alive; they should evolve alongside your business.
