

 Français
 Mastering the average order value formula to boost your sales
Discover how the average order value formula can transform your business. Learn how to calculate it and use our strategies to increase your revenue.

The average order value formula is disarmingly simple: take total revenue and divide it by the number of orders recorded over a given period. This key performance indicator (KPI) simply gives you the average value of every transaction made with your business.
Understanding average order value to better steer your business
To picture it clearly, imagine you run a restaurant. At the end of service, what interests you isn’t just how many tables you filled. You want to know, above all, how much each table spent on average. Average order value is exactly that. It’s the financial pulse of your business, whether you run an online shop or a physical store.
This indicator, often referred to by its acronym AOV (for Average Order Value), is far more than just a number on a dashboard. It tells you a lot about your customers’ purchasing behavior and the relevance of your sales strategies. A high average order value is often a good sign: your customers like what you offer and are willing to buy more. Conversely, a lower figure may signal room for improvement.
Calculating average order value is really the starting point for any strategy aimed at growing your revenue sustainably. By keeping an eye on it, you can gauge the effectiveness of your marketing actions, spot products that sell well together, and fine-tune your offers to get the most out of every sale.
Why does this calculation matter so much?
Tracking this indicator means giving yourself the means to make informed decisions to grow your business. Here’s what it concretely gives you:
- Measuring your profitability: It helps you see whether each sale properly covers your costs and, above all, generates profit.
- Evaluating your strategies: Did your latest promotion really push customers to spend more? The evolution of your average order value will give you the answer, straight up.
- Identifying opportunities: It highlights the periods when people spend more (the end-of-year holidays, for example) or less, letting you adjust course at the right time.
In France, the principle stays the same: revenue is divided by the number of transactions, regardless of how many items are in each order. To go further into how French businesses use it day to day, you can explore the details of average order value calculation on kerawen.com. It’s an absolutely fundamental metric for decoding consumption trends.
Now that we’ve laid the groundwork, let’s get practical. Knowing the formula is good, but knowing how to apply it concretely to your business is even better. The good news? The calculation is genuinely simple and works for everyone, whether you’re a solo operator or leading a small team.
As a reminder, the magic formula is as follows: Total revenue / Total number of orders.
Nothing more, nothing less. It’s a direct calculation that will give you a clear picture of the average value of each transaction.
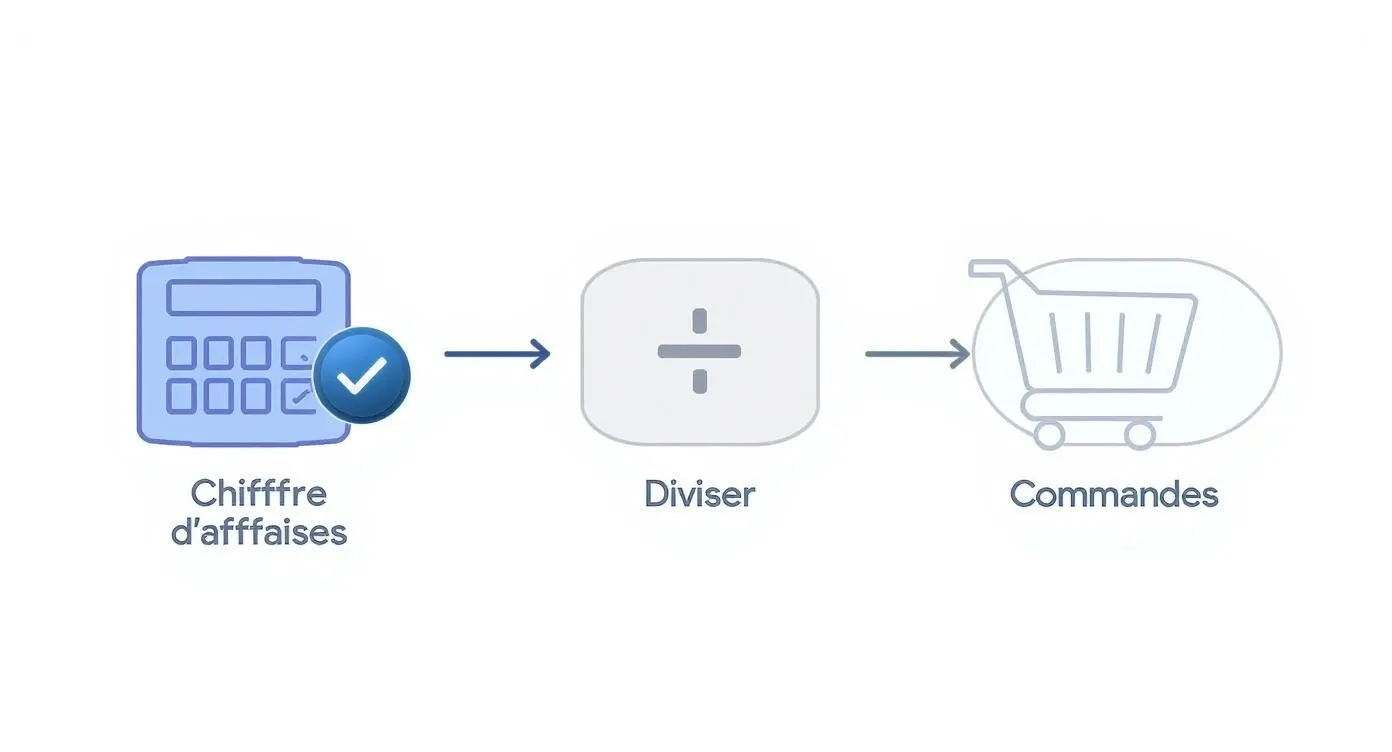
This diagram perfectly illustrates the principle: you take the total revenue collected and divide it by the number of times a customer completed a purchase.
Step 1: Gather the right information
Before diving into the calculations, the first thing to do is choose the period you want to analyze. Last month? The quarter that just ended? The full year? It’s up to you, but the important thing is to stay consistent.
Once the period is defined, you need two key figures:
- Total revenue (excl. VAT) you generated.
- The total number of unique orders recorded over that same period.
Watch out for a common trap: don’t confuse the number of orders with the number of products sold or the number of customers. A single customer can place several orders, and a single order can contain many items. What matters here is the number of distinct transactions.
Step 2: Run the calculation — it’s really simple
With your two figures in hand, all that’s left is to do the division. It’s as simple as that. To make things even clearer, let’s see how this applies to very different situations.
**Example 1: The e-commerce sole trader (B2C)**Imagine a jewelry maker who generated €4,500 in revenue last month, from 90 orders.
- Her calculation: €4,500 / 90 orders
- Her average order value: €50
In concrete terms, this means that on average, each person who bought from her shop spent €50.
**Example 2: The service business (B2B)**Take a digital marketing agency. Last quarter, it billed €30,000, corresponding to 25 different projects (each project counting as an “order”).
- Its calculation: €30,000 / 25 projects
- Its average order value: €1,200
Each signed contract therefore brings in an average of €1,200.
Examples of average order value calculations by industry
This table illustrates the average order value calculation with fictional data for different types of businesses, showing the simplicity and universality of the formula.
| Business type | Revenue (period) | Number of orders | Calculation | Average order value |
|---|---|---|---|---|
| Online florist (monthly) | €6,000 | 150 | €6,000 / 150 | €40 |
| Freelance developer (quarterly) | €15,000 | 5 | €15,000 / 5 | €3,000 |
| Café / Small restaurant (weekly) | €2,100 | 300 | €2,100 / 300 | €7 |
| SaaS software sales (monthly) | €25,000 | 500 | €25,000 / 500 | €50 |
As you can see, whether you sell €7 coffees or €3,000 services, the principle remains exactly the same.
Step 3: Handle special cases, like foreign currencies
If your business involves selling internationally, you’ll inevitably have to juggle different currencies. For your average order value to remain a reliable indicator, it’s crucial to bring everything back to a single currency.
The most rigorous method is to convert each transaction into your main currency (the euro, for example) using the exchange rate on the day of the sale. This is the only way to avoid your analysis being skewed by market fluctuations.
Fortunately, you don’t have to do this by hand. A good invoicing tool, like Bizyness, handles these conversions automatically. This saves you precious time while guaranteeing the reliability of your figures.
Analyzing your average order value from every angle
Calculating a global average order value is good. It’s a solid starting point. But this figure, a bit like a class’s overall average, often hides significant disparities. To really understand what’s going on and make decisions that matter, you need to go further and break down this indicator. Think of it like a group photo: the whole picture looks nice, but it’s by zooming in on each face that you discover the real personalities.

By analyzing the average order value formula by segment, you pinpoint who your best customers are, which marketing campaigns are performing well, and how your new buyers behave. This more detailed approach turns a simple number into a genuine dashboard for steering your business.
Average order value per customer
This first variation is essential for spotting your gold-standard customers, the ones who spend the most with you over the long term. It’s the best way to highlight these loyal buyers who deserve your full attention.
The formula is very simple:
- Average order value per customer = Total revenue generated by a customer / Total number of their orders
**A concrete example?**Imagine a customer, let’s call them “Customer A.” They placed 4 orders with you, for a total spend of €480. Their personal average order value is therefore €120. By identifying all your “Customer A” types, you can put together exclusive offers or early access to your new products for them. It’s an excellent way to strengthen their loyalty and a key step in learning to better segment your customer base and personalize your actions.
Average order value of first orders
Here’s a crucial indicator for judging how effective your efforts to attract new customers are. It tells you, in black and white, how much a new customer spends on average the very first time they buy from you.
A high average order value right from the first purchase is a telling sign. It means your welcome offer or your advertising didn’t just catch the eye — it also managed to convince this newcomer of the value of what you offer.
**A concrete example?**You launch a social media ad campaign. By closely tracking the average order value of the first orders that result from it, you can assess its return on investment. If the average order value of these new customers reaches €75 while your usual average is €50, that’s a real win. Your campaign hit the right target.
Recurring average order value, the key indicator for subscriptions
If your business relies on a subscription model, this analysis is simply fundamental. It lets you measure the average value of each payment that comes in regularly and understand the profitability of your different plans.
The formula adapts slightly:
- Recurring average order value = Monthly recurring revenue (the famous MRR) / Total number of active customers
**A concrete example?**Take a software publisher that offers three plans: Basic at €10, Pro at €30, and Expert at €60. By calculating its recurring average order value, it discovers it’s €22. This information is telling: the vast majority of its customers stick with the entry-level plans. This may be the signal it’s been waiting for to launch a targeted marketing campaign and encourage customers to upgrade to a higher plan.
Putting your average order value in perspective with other indicators
Analyzing the average order value formula on its own is a bit like watching a football match while only ever looking at one player. You see clearly what they’re doing, but you miss the whole team strategy and the dynamics of the game. To truly grasp what your average order value means, you need to connect it to other key performance indicators (KPIs).
This approach gives you a 360-degree view of your business’s health. A rising average order value is great. But if, at the same time, your conversion rate is collapsing, the final outcome could well be negative.
The inseparable link with conversion rate
Average order value and conversion rate are two sides of the same coin. The first tells you how much your customers spend on average per order, while the second tells you what proportion of your visitors actually go on to buy.
Imagine you launch a very aggressive upselling strategy. Your average order value could shoot up, for sure. But if this aggressive approach scares off new visitors, your conversion rate will drop. It’s all a matter of balance to ensure healthy, sustainable growth.
The profitability equation: LTV over CAC
The real magic happens when you pair average order value with two other heavyweights of business analysis:
- Customer Lifetime Value (LTV): This is the total revenue a customer will generate for you throughout their relationship with your business.
- Customer Acquisition Cost (CAC): This is everything you spend on marketing and sales to convince a new person to become a customer.
A healthy LTV/CAC ratio, generally considered solid above 3, means your business model holds up. And that’s where average order value becomes your best ally. Increasing average order value has a direct and powerful leverage effect on this ratio. Every euro added to the order pushes up LTV, often without moving your CAC by a single cent.
A small effort to increase average order value by a few euros can turn a barely acceptable LTV/CAC ratio into a formidable profitability engine. It’s one of the fastest ways to boost your margins without massively reinvesting in acquisition.
Finally, never forget to look at what’s happening around you. External factors like inflation, for example, directly weigh on purchasing power and consumption habits. Your average order value evolves within a broader economic context, tied in France to the consumer price index (CPI). This index, which measures price trends, helps you know whether the rise in your average order value comes from your good strategies or simply from the general increase in costs. To learn more, you can check out this article on the role of the CPI and how it’s calculated on capital.fr.
If you want to dig deeper and discover other key indicators, feel free to read blog articles on KPIs and business strategies to enrich your toolkit.
Putting in place strategies to increase your average order value
You’ve calculated your average order value? Great. Now the real work begins: making it grow. This isn’t about pushing consumption, it’s about turning your data into concrete actions so that every customer wants to spend a little more, simply because you’re offering them more value.

Fortunately, there are techniques that have largely proven themselves. Used well, they fit smoothly into the buying journey and can even end up improving the customer experience. Let’s look at the most effective ones.
Offering complementary products with cross-selling
Cross-selling is the most direct and often the most well-received method. The idea is simple: when a customer puts a product in their cart, you suggest other items that go with it.
Take a concrete example: someone buys a camera. It’s the ideal opportunity to offer them a memory card, a protective case, or a tripod. These aren’t random suggestions; they’re products that meet a logical need arising from their main purchase. Not only do you increase the value of their order, but you also help them avoid forgetting something important.
Suggesting an upgrade with upselling
Upselling is another approach, just as powerful. Here, you offer the customer an improved, higher-performing, or premium version of the item they’re interested in. The goal is to show them that with a small additional financial effort, they can get a much better experience.
Imagine a customer looking at a basic software subscription. You can subtly highlight the Pro version. But for this to work, you need to be very clear about the concrete benefits: more features, priority customer support, etc. The customer needs to feel that this little extra is truly worth it.
A good upselling strategy doesn’t just show a more expensive product. It must justify the price difference with tangible, desirable benefits for the customer.
Creating attractive bundled offers
Bundling is a formidable technique. The principle? You group several complementary products into a pack, at an overall price more attractive than if each item were purchased separately.
- Example for a service: A marketing consultant can offer a “Website creation + Basic SEO strategy” pack at a preferential rate.
- Example for a product: A cosmetics brand can create a “Morning routine kit” including a cleanser, a serum, and a moisturizer.
For the customer, it’s a good deal. And for you, it’s a sale of several items instead of just one. Everyone wins.
Setting up smart incentives
Beyond these three pillars, other levers can make a real difference. Setting a threshold for free shipping is a classic that always works. The little message “Only €10 more for free shipping!” can be the nudge that triggers an additional purchase.
Along the same lines, a well-designed loyalty program can reward higher orders by offering more points. Every order then becomes a step toward a future reward, which encourages customers to optimize their purchase. If you’re looking for other ideas, our guide to boosting your e-commerce sales will give you even more concrete leads.
Tracking your indicators effortlessly with Bizyness
For a sole trader or someone running a small business, manually calculating average order value and other performance indicators is a bit like trying to fill a pool with a thimble. It takes forever, and the risk of getting it wrong is very real. Every hour spent juggling numbers is an hour less spent growing your business.
That’s exactly why we created Bizyness. Our management tool is designed to relieve you of this administrative burden. It doesn’t just calculate your average order value for you; it automates the tracking of all your key financial indicators, without you having to lift a finger.
Steer your business in real time, not at month-end
No more waiting for month-end close to take stock. With Bizyness, all your sales data is centralized and updated live. The result? You get visual dashboards that turn a pile of raw numbers into informed decisions.
A single glance is enough to understand the health of your business.
This overview lets you track the evolution of your average order value, filter it by period or customer type, and cross-reference it with your revenue. It’s the best way to make decisions based on facts, not impressions.
For those who want to go even further, our guide on the financial dashboard will give you concrete examples for building your own reports. The payoff is immediate: you save precious time, you make your decisions more reliable, and you run your business with remarkable clarity.
The questions everyone asks about average order value
Even with the formula in mind, very concrete questions can come up when it’s time to act. We’ve gathered the most common ones here to give you clear answers and help you take your analysis further.
What’s a “good” average order value in my field?
Honestly, there’s no one-size-fits-all answer. A “good” average order value is above all a figure that makes sense for you. It all depends on your industry, your products (you don’t sell coffee the way you sell software), and your positioning.
For a small shop, an order of €7 can be an excellent result. For an agency working with businesses, we’d be talking about several thousand euros instead.
The smartest approach is to measure yourself against yourself. The real goal is to see this figure rise steadily, month after month or quarter after quarter. That’s the clearest sign that your efforts are paying off.
How often should I calculate it?
The right frequency depends on the pace of your business.
- If you run an e-commerce store or a shop (B2C): A monthly check is perfect. It lets you stay responsive and spot a trend without getting alarmed by the slightest daily fluctuation.
- If you’re in services or B2B: Go for a quarterly analysis instead. Sales cycles are longer, so looking at figures over three months gives a much more accurate and stable picture of the situation.
The secret is consistency. Whatever frequency you choose, stick to it. That’s what will let you compare like with like and identify real trends over time.
B2B or B2C, does that change anything in the analysis?
Absolutely. In B2C, average order value often reflects more spontaneous purchases, very sensitive to promotions or last-minute suggestions. So you’ll want to optimize each sale with techniques like cross-selling to push up the total.
In B2B, the purchasing decision is much more considered, and the amounts are generally higher. Average order value analysis fits into a broader reflection on a customer’s long-term value (the famous LTV). Here, the average order value formula is mainly used to measure the profitability of newly signed contracts.
If you have other questions, many platforms offer frequently asked questions sections that can shed further light.
Tracking all these figures by hand can quickly become tedious. Bizyness is precisely there for that: it automatically calculates your average order value and presents it in clear dashboards. So you can run your business with total peace of mind. Discover how to simplify your management today at bizyness.fr.
