

 Français
Break-even point calculation: the guide for entrepreneurs
Master the break-even point calculation to steer your profitability. Discover the formula, real-world examples and the pitfalls to avoid to secure your business.

Do you know exactly when your business starts generating profit? That’s precisely what the break-even point calculation lets you determine. We’re talking about the day of the year when your cumulative revenue finally covers all your costs, whether fixed or variable.
Put more simply, it’s the date from which every euro collected becomes pure profit. A true milestone in the life of a business!
The break-even point: far more than a simple indicator
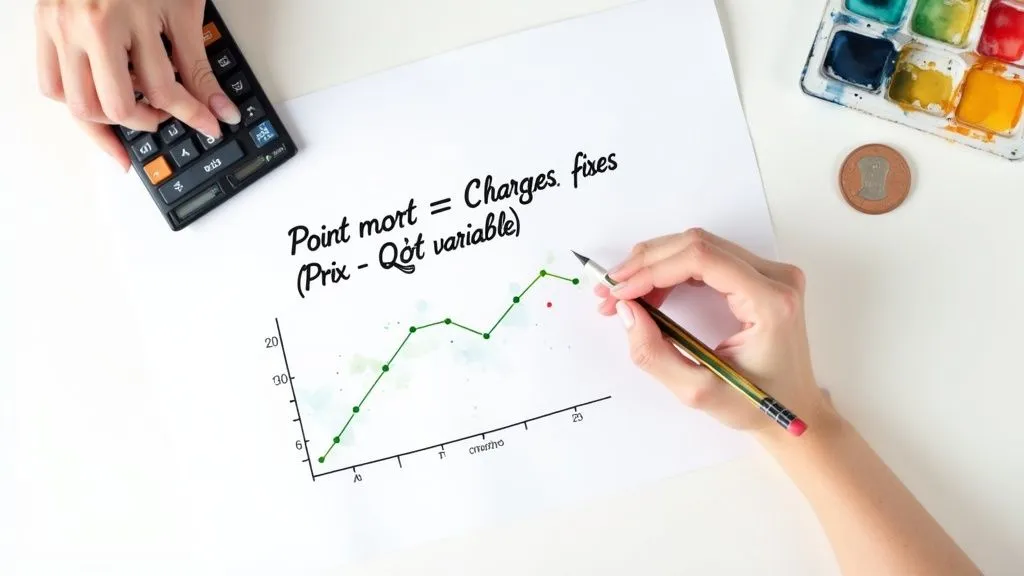
Don’t think of the break-even point as an abstract accounting concept. Think of it instead as a GPS for your business. It takes a financial figure – the break-even threshold, expressed in euros – and turns it into a very concrete piece of time-based data: a number of days.
This shift radically changes the perspective for an entrepreneur. Instead of chasing a revenue amount, you’re aiming for a specific date on the calendar. Much more motivating, isn’t it?
The formula you need to know by heart
The calculation itself is fairly straightforward once you’ve determined your break-even threshold. Just apply a simple rule of three:
Break-even point (in days) = (Break-even threshold / Annual revenue) x 365
Let’s take a concrete example: if your break-even threshold is €75,000 and you’re aiming for annual revenue of €100,000, the calculation is as follows: (75,000 / 100,000) x 365 = 274 days. Your business will therefore start being profitable from the 274th day of the year onward.
But what’s it actually used for?
Knowing this projected date isn’t a gimmick. It’s an essential strategic steering tool that helps you make better decisions throughout the year. Thanks to it, you can:
- Better manage your cash flow, by anticipating needs for the months when you’re not yet profitable.
- Set clear and motivating sales targets for your teams.
- Measure the impact of a decision, such as a new investment or hire, on your future profitability.
- Correct course quickly if you see that the break-even point is too far off in the year.
In short, mastering your break-even point gives you a clear read on your company’s performance. It’s a powerful lever for steering your growth with more confidence and precision.
Why the break-even point is your best strategic ally
The break-even point calculation goes far beyond a simple accounting exercise. Picture a GPS: instead of showing you the best route, it tells you the exact moment your business stops running in the red and finally starts generating profit.
This time-based perspective changes everything. Rather than chasing an abstract revenue figure, you have a clear, tangible target. It’s a real motivation booster for you and your teams.
Steering beyond the numbers
Knowing your break-even point means making more informed decisions. Take the example of a young French food tech startup. Its initial fixed costs are high: app development, launch campaign, technical team salaries. Its initial break-even point falls in November.
Knowing this, the team understands it has ten months to adjust course if sales don’t hit forecasts. The result? Sharper cash flow planning and less stress before renegotiating a loan.
The break-even point is your waterline: the level at which your business can sail with confidence, even when the sea gets rough.
This indicator serves as a common language with bankers or investors. Showing that you have a firm grasp of your break-even point calculation proves the soundness of your economic vision.
A day-to-day decision-making tool
The break-even point isn’t set in stone: it shifts with every strategic choice. Before taking action, here are a few questions worth asking:
-
Should we hire an additional salesperson? Assess the impact of this fixed cost on your break-even point and estimate the number of sales needed to make it pay off.
-
Is it time to buy a new machine? Model the cost increase and calculate the break-even threshold you should expect.
-
Should you revisit your pricing? A price increase brings your break-even point closer… provided volume doesn’t collapse.
The break-even point concept is essential to business management in France: it marks the shift from loss to profit. To go further, check out the resources on the CRA website.
Here’s a visual example often used to clarify these concepts:
| Volume (units) | Total costs | Revenue |
|---|---|---|
| 0 | €50,000 | €0 |
| 1,000 | €50,000 | €75,000 |
| 2,000 | €50,000 | €125,000 |
| 3,000 | €50,000 | €175,000 |
The break-even point sits where the cost and revenue curves cross, becoming a simple reference point anyone can read.
Telling fixed costs apart from variable costs
For your break-even point calculation to hold up, everything starts with a fundamental distinction: fixed costs versus variable costs. Believe me, one small classification error is enough to completely throw off your analysis and, potentially, lead you to make the wrong decisions.
It’s fairly simple in theory. A fixed cost is an expense that doesn’t move, whether you post record revenue or have no customers at all. Think of your premises’ rent or your accounting software subscription: the bill falls due every month regardless of your activity.
Conversely, a variable cost is directly tied to your volume of activity. The more you sell, the higher it climbs. Makes sense.
A few concrete examples to make it clearer
To make this more tangible, let’s imagine two completely different businesses.
Take a restaurant owner:
- Their fixed costs? Rent, permanent staff salaries (kitchen and floor), insurance contracts, or the depreciation of their pizza oven.
- And their variable costs? The cost of buying ingredients (flour, tomatoes, cheese), commissions taken by delivery platforms, and of course the wages of an extra hire for a busy Saturday night service.
Now, a digital marketing agency:
- Its fixed costs? Consultant salaries, licence fees for SEO tools or the CRM, office expenses.
- Its variable costs? Advertising budgets managed on behalf of clients, commissions paid to a referral partner, or fees for a freelancer brought on for a one-off project.
The foolproof trick to avoid getting it wrong is to ask yourself this simple question: “If my revenue is zero next month, do I still have to pay this expense?” If the answer is yes, it’s a fixed cost. Full stop.
This distinction isn’t a mere accounting exercise, it’s the foundation of management. For example, if you have €30,000 in fixed costs and your variable costs come to €100,000 for a given level of production, you’ll need to generate at least €130,000 in revenue just to cover those costs.
Here’s a chart that perfectly illustrates this breakdown.
You can clearly see that the fixed cost line stays flat, while the variable cost line rises alongside production. Exactly right.
Watch out for the semi-variable cost trap
To complicate things a little, some expenses are somewhat hybrid. They’re called semi-variable costs: they have both a fixed portion and a variable portion. The classic example is the electricity bill for a production workshop. You have the subscription (the fixed part) and the consumption, which depends on how many machines are running (the variable part).
For a truly reliable break-even point calculation, you absolutely need to dissect these costs. Try to isolate the unavoidable fixed portion from the one that fluctuates with your activity. This rigor will spare you unpleasant surprises. On that note, to go further, I’d recommend looking into the concept of direct and indirect costs, which adds another very useful lens to your financial analysis.
The break-even point calculation, step by step
Theory is great, but practice is even better. The break-even point calculation might seem a bit intimidating at first glance, but you’ll see, the logic is actually very simple. Let’s break it down together. You don’t need to be a seasoned chartered accountant to master this tool; a methodical approach is more than enough.
The idea is to start from your list of expenses and arrive at a concrete revenue target. That’s the famous minimum revenue figure, the break-even threshold, which lets you say: “There we go, I’m no longer losing money.” At this stage, you’re not yet making a profit, but all your expenses are covered.
Let’s take the example of an e-commerce shop
Let’s set the scene. Imagine you’re launching an online shop selling a single product: trendy reusable water bottles. For your first year, you’ve estimated the following figures.
- Your selling price for a bottle: €25
- The purchase cost of the bottle from your supplier: €10
- The transaction fees (Stripe or PayPal type) for each sale: €1
- The packaging and shipping cost for each bottle: €4
These last three items are what’s known as your variable costs. They only appear if you sell something. The calculation is quick: 10 + 1 + 4 = €15. Each sale therefore costs you €15 in variable costs.
Alongside this, you have expenses that come due every month, whether you sell or not. These are your annual fixed costs.
- E-commerce platform subscription (say, Shopify): €350
- Advertising and marketing budget (Google Ads, social media): €3,000
- Rent for a small storage unit: €2,400
- Miscellaneous other costs (bank, insurance, etc.): €250
Your total annual fixed costs therefore come to €6,000.
This infographic perfectly sums up the essential difference between these two types of costs.
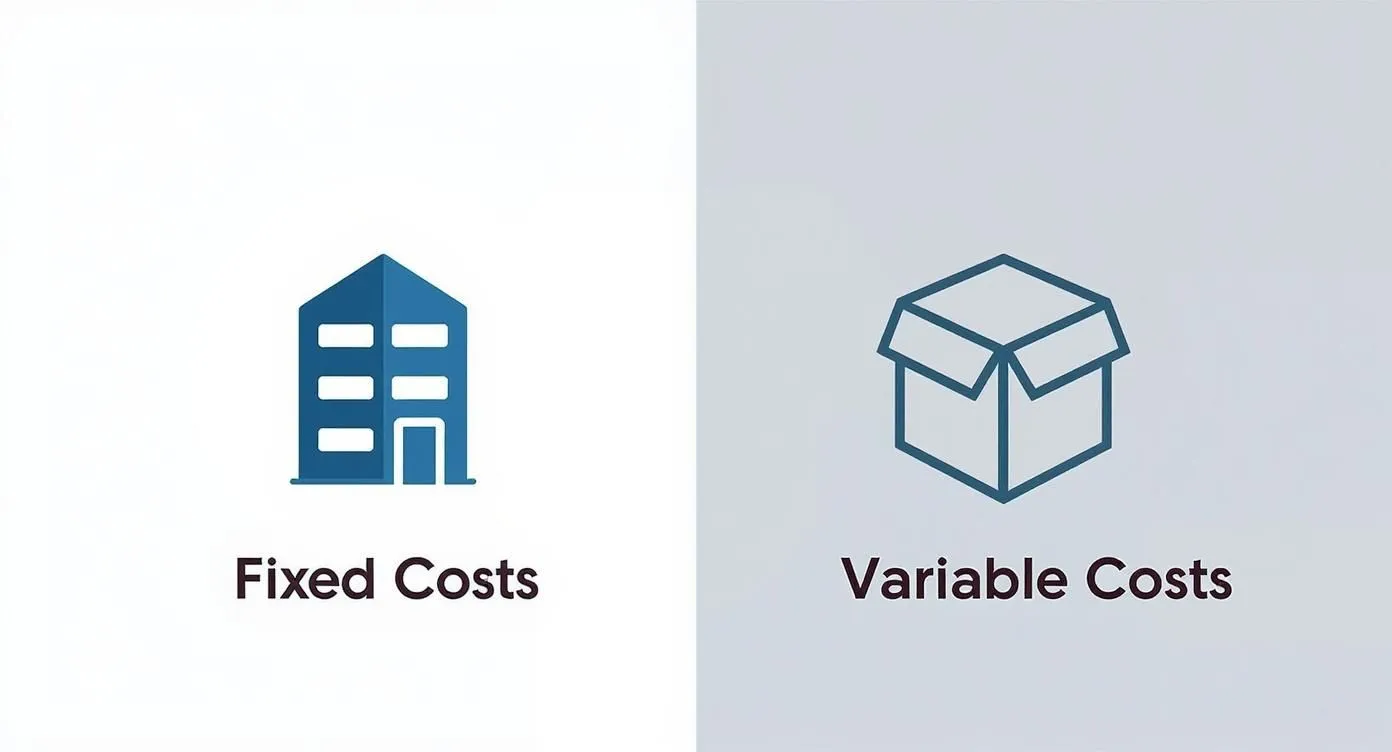
You can clearly see that fixed costs, like rent, don’t move, while variable costs, like buying your bottles, climb with every new sale.
First mission: calculate your contribution margin
Before anything else, you need to know how much each sale actually earns you toward paying your fixed costs. This is known as the contribution margin.
The formula is straightforward: Unit contribution margin = Unit selling price - Unit variable costs
In our case: €25 - €15 = €10. Every time you sell a bottle, you generate €10 that will go toward paying your rent, your marketing, and everything else.
This margin can also be expressed as a percentage. This is known as the contribution margin rate. Contribution margin rate = (Unit contribution margin / Unit selling price) x 100
For our shop: (€10 / €25) x 100 = 40%. In other words, 40% of your revenue is actually available to cover your fixed costs.
Second mission: determine your break-even threshold
Now that you have these figures in hand, calculating the break-even threshold becomes child’s play. If financial formulas give you cold sweats, keep in mind that solid math skills are a valuable asset; resources like general math tutoring can sometimes make all the difference.
To find the break-even threshold in euros: Break-even threshold (€) = Fixed costs / Contribution margin rate
Which gives us: €6,000 / 0.40 = €15,000. You therefore need to reach €15,000 in revenue for your business to break even.
And to find out how many products to sell: Break-even threshold (units) = Fixed costs / Unit contribution margin
Here: €6,000 / €10 = 600 units. You’ll need to sell 600 bottles over the year to cover all of your costs.
The figure to remember: Your shop won’t start making money until the 601st bottle sold. Every sale made before that point simply goes toward paying off your costs.
To make things clearer, here’s a table summarising our concrete example, walking through the steps from costs to the revenue target.
Table: Example break-even point calculation for an e-commerce business
| Calculation step | Example figures | Formula applied |
|---|---|---|
| 1. Calculate unit variable costs | €15 | Purchase cost (€10) + Transaction fees (€1) + Shipping (€4) |
| 2. Calculate annual fixed costs | €6,000 | Shopify (€350) + Marketing (€3,000) + Rent (€2,400) + Other (€250) |
| 3. Calculate contribution margin | €10 | Selling price (€25) - Variable costs (€15) |
| 4. Calculate contribution margin rate | 40% | Contribution margin (€10) / Selling price (€25) |
| 5. Calculate break-even threshold (in volume) | 600 units | Fixed costs (€6,000) / Contribution margin (€10) |
| 6. Calculate break-even threshold (in revenue) | €15,000 | Fixed costs (€6,000) / Contribution margin rate (0.40) |
Organising this data in a simple spreadsheet is an excellent idea. It lets you play with the numbers and easily simulate different scenarios: “What if I raise my selling price?” or “What happens if my rent goes up?”
By the way, all this information forms the basis of a fundamental accounting document for steering your business. To go further, we explain in detail how to draw up a profit and loss statement in our dedicated template.
So, what do you do with this break-even point?
You’ve calculated your break-even point. Well done! You have a figure, maybe even a date in your calendar. But careful, that’s only the first step. What matters most is turning this raw result into smart decisions for your business.
Let’s be clear: a break-even point reached at the end of September is neither a victory nor a defeat. It all depends on context: your industry, your business model, your goals… The real magic of this indicator is using it as a daily compass.
The break-even point, your best decision-making tool
Don’t see your break-even point as a fixed verdict. Think of it instead as your car’s dashboard. Every decision, every turn you take, moves the needle. Understanding this mechanism is what lets you truly take control of your profitability.
Let’s look at a few concrete examples of how to use it:
- Fine-tune your pricing policy: Does your break-even point feel too far off? A small price increase can have a dramatic effect. Run the simulation: what does a 5% increase do to your margin? You might be surprised by the result.
- Validate an investment: Tempted by a new machine? Factor its cost (depreciation) into your fixed costs and recalculate. You’ll know instantly how many additional sales you need to make so that this investment isn’t just an expense, but a real growth driver.
- Justify a hire: A new team member is great, but it’s also an added fixed cost. The break-even point calculation will show you very clearly how many more days or sales are needed to cover this salary. The decision immediately becomes less subjective.
It’s one thing to look at a profit and loss statement. It’s another to know you need to sell 50 more products to justify a hire. The break-even point makes your decisions far more tangible.
Speaking the same language as your banker
When you sit down with your banker or investors, showing up with a firm grasp of your break-even point completely changes the conversation. You’re no longer just selling a product or a vision; you’re proving you understand the financial mechanics of your business.
Announcing that your strategy is to bring your break-even point forward by 30 days over the next financial year is a clear, measurable, and remarkably reassuring goal for your partners. It’s proof of rigorous, fact-based management. Believe me, that’s a mark of credibility that can make all the difference in securing financing.
A principle that reaches far beyond business
The idea of finding an equilibrium threshold is so powerful that it turns up in fields you wouldn’t expect. In France, for example, similar principles are used in regional planning to calculate housing needs and ensure a city or region can absorb demographic changes. For the curious, the detailed analysis by Cerema on the subject is fascinating.
Their report uses complex models, as this illustration shows, but the underlying idea remains the same.
Even though the calculations go further, the goal is identical: finding the equilibrium point that guarantees the viability and sustainability of the system.
Ultimately, your break-even point is your best ally for turning ambition into a concrete action plan. Keep an eye on it, and you’ll stop reacting to events: you’ll anticipate them. To go further and integrate this tool into your management, take a look at our guide on sales forecasting techniques.
Mistakes to avoid for a reliable calculation

Calculating your break-even point is one thing. Doing it reliably is the key to making strategic decisions that hold up. On paper, the formula looks simple, but in practice, a few classic pitfalls can completely throw off the result and lead you astray.
The first, and by far the most common, blunder is mixing everything up on a VAT-inclusive basis. Remember this: your profitability is always calculated excluding VAT. VAT is money you merely collect on behalf of the government; it passes through your account but isn’t yours. Including it in your calculations skews your revenue and costs from the outset.
Another mistake I see often is underestimating costs, especially variable ones. People think of the big-ticket items but forget the small ones that, once added up, weigh heavily. Have you properly accounted for your payment terminal’s transaction fees? The cost of packaging and deliveries? The commissions you pay to your partners? Every small oversight quietly eats into your margin and pushes back the actual moment you start making money.
Up-to-date data, or nothing at all
A break-even point calculation is only relevant if it’s based on fresh information. The danger is reusing last year’s figures without a second thought. Except since then, the price of your raw materials may have gone up, or the cost of that essential software subscription may have increased.
Think of your break-even point as a dashboard, not a snapshot. It needs to evolve in real time with your business. Recalculate it as soon as a major change occurs in your costs or pricing policy.
This discipline forces you to stay connected to your business’s reality and to adjust course quickly. For effective management, the golden rule is simple: always work from the most recent data.
Beware the effect of seasonality
Finally, one last pitfall is ignoring the seasonality of your business. The basic formula is a bit naive: it smooths your sales over the whole year. But reality is rarely that linear.
- An ice cream seller knows very well that their peak activity falls between June and August.
- A B2B consultant often experiences a significant slowdown during the summer holidays.
For a break-even point calculation that truly reflects reality, you absolutely need to refine your forecasts month by month. This will give you a much more accurate picture of when you’ll reach equilibrium and, above all, spare you major cash flow scares during the lean periods.
Answering your questions about the break-even point
Even with the formula in mind, very concrete questions often come up when you’re starting out. That’s normal! Let’s go through the most frequent questions so that the break-even point calculation becomes a genuine reflex in managing your business.
How do you calculate the break-even point for services?
That’s an excellent question, especially for consultants, freelancers or agencies. The basic idea doesn’t change, but the logic is adapted slightly. Here, your “product” is your time. The first thing to do is therefore to quantify your production capacity: how many hours or days can you bill over the year?
Next, to find your contribution margin, simply take your hourly (or daily) rate and subtract all the costs directly tied to an assignment: travel to a client, the cost of a subcontractor, buying specific software for a project, and so on. The final result won’t be a number of products to sell, but rather the number of hours or days you need to bill to cover all your fixed costs.
How often should this calculation be updated?
The break-even point isn’t a figure you calculate once and for all. It’s a living indicator that needs to evolve alongside your business. It’s crucial to recalculate it as soon as a significant element of the equation changes.
Remember to update it if:
- Your fixed costs shift: your rent goes up, you hire someone, you sign up for a new online tool.
- Your margin changes: the price of your raw materials rises or, conversely, you decide to raise your rates.
- You make a significant investment: buying a new machine, a company vehicle, and so on.
As a good habit, I’d recommend checking your break-even point at least once a quarter. It gives you a clear view of your trajectory and lets you correct course quickly if needed, well before you receive your year-end results.
How do you use it to motivate sales teams?
The break-even point is a fantastic tool for setting meaningful sales targets. Forget big revenue figures that can feel abstract. Bring the goal down to something tangible. For example, instead of aiming for “€100,000 this quarter”, say instead: “This month, our target is to sell 85 units to break even. Every additional sale is a bonus for everyone!”
This approach changes everything. Every team member immediately understands their direct impact on the company’s profitability. Far more motivating!
Manage your profitability effortlessly with Bizyness. Our tool simplifies tracking your costs and revenue, giving you a clear view to reach your break-even point faster. Discover how Bizyness can transform your management.
