

 Français
Excel Accounting Tracking Spreadsheet: Optimize Your Management
Optimize your management with our Excel accounting tracking spreadsheet: turn your data into informed decisions.

Why an Excel accounting tracking spreadsheet transforms your management
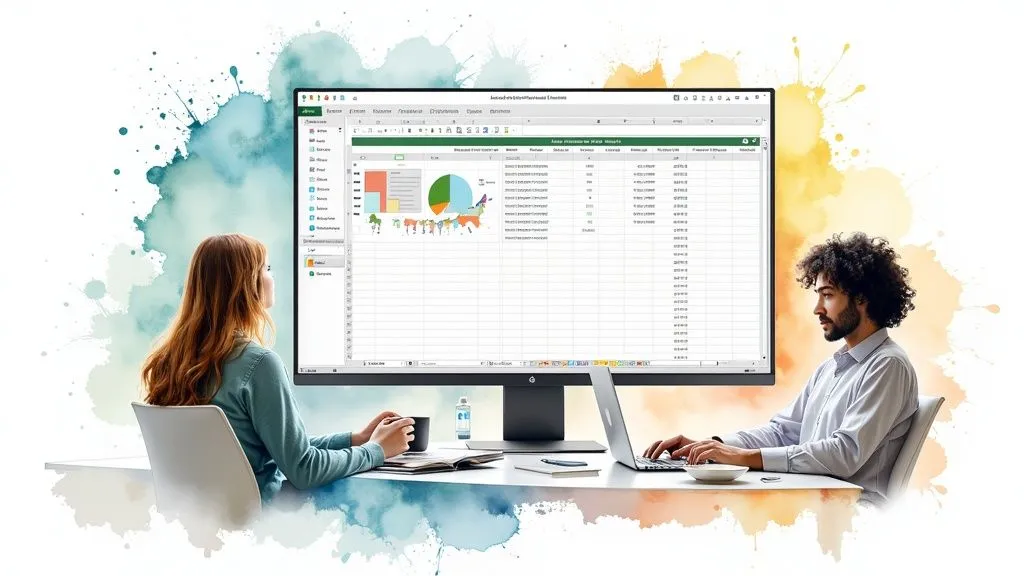
Let’s face it, accounting management can turn into a real headache, especially for sole traders and small businesses. An Excel accounting tracking spreadsheet then becomes a valuable ally that considerably simplifies this process and helps you regain control of your finances. Its main strength? A clear and immediate visualization of your company’s financial health, allowing you to make wiser decisions on a daily basis.
Clarity and control for informed decisions
For many entrepreneurs, accounting evokes a world of complex numbers and hard-to-understand jargon. The Excel accounting tracking spreadsheet demystifies this data by presenting your financial information in a structured way. This makes it easier to track your cash flow, identify your expenses and observe the evolution of your revenue. This transparency lets you anticipate potential problems and react quickly to market fluctuations, freeing up time to focus on the core of your business.
An accessible tool that adapts to every business
Unlike accounting software, which is often costly, Excel is a tool most professionals already have. Its great flexibility lets you create a customized tracking spreadsheet, perfectly suited to your company’s specifics. Whether you’re a sole trader, freelancer, or small business owner, you can configure your spreadsheet to track the indicators most relevant to your activity.
Creating such a tool, however, requires a methodical approach. According to Appvizer, this process involves four essential steps: defining your needs and objectives, identifying your key performance indicators (KPIs), designing your dashboard, and updating it regularly. In France, this method allows companies to save valuable time by automating data entry on a defined schedule and tracking essential indicators such as revenue, expenses and results.
Simplicity and savings: a decisive advantage for small businesses
For small businesses and sole traders, investing in specialized accounting software often represents a significant expense. The Excel accounting tracking spreadsheet offers an economical alternative without compromising effectiveness. It guarantees you precise control of your finances without requiring a major investment.
Its intuitive handling makes it accessible even without in-depth accounting expertise. It’s therefore the ideal tool for entrepreneurs who want to manage their own accounting on a daily basis. The savings made can be reinvested in other essential aspects of your business development, such as marketing or innovation.
The essential components that make the difference
A well-designed Excel accounting tracking spreadsheet is much more than a simple table of figures. It becomes a genuine financial management tool that gives you a clear and precise view of your business. To create such a tool, certain key elements must be included. These components, when combined effectively, allow you to analyze your accounting data from different angles.
Structure and organization: the foundation of a high-performing spreadsheet
The performance of a tracking spreadsheet primarily rests on its structure. A clear organization, with well-defined sections, greatly facilitates reading and interpreting the data. Dividing it into specific tabs for the balance sheet, the income statement and cash flow is a fundamental first step. Don’t hesitate to use a consistent color code to easily distinguish the different categories (income, expenses, etc.).
Formulas and automation: saving time and avoiding errors
One of Excel’s main advantages is its ability to automate calculations. Mastering basic formulas like SUM, PRODUCT or VLOOKUP is essential for creating an effective tracking spreadsheet. These functions save you valuable time while considerably reducing the risk of manual errors. For example, automate your VAT or margin calculations using suitable formulas.
The power of intermediate management balances
Integrating intermediate management balances (SIG) into your spreadsheet enables an in-depth analysis of your company’s performance. These essential indicators, such as operating income, financial income and net income, help you assess the profitability of your business. In France, many companies use automated Excel models to calculate these SIGs and get a precise view of their financial health. To learn more, discover more information on SIGs.
Data validation and control: ensuring the integrity of your information
A tracking spreadsheet, however sophisticated, loses all value if the data it contains is incorrect. It is therefore crucial to set up validation mechanisms. Use Excel’s data validation function to control entries and prevent errors. Drop-down lists, custom alert messages and conditional formatting strengthen the reliability of your data.
Pivot tables: harnessing the power of analysis
Pivot tables are powerful tools for analyzing your accounting data from different angles. They let you summarize large amounts of information and identify important trends. You can, for example, analyze your sales by product, by region or by period. This feature gives you a multidimensional view of your business and helps you spot growth levers.
Concrete examples: drawing inspiration from best practices
Many companies have optimized their accounting management thanks to well-designed Excel spreadsheets. Draw inspiration from these examples to structure your own data and obtain relevant information quickly. For instance, an online store might use a tracking spreadsheet to analyze sales evolution based on marketing campaigns. An independent consultant, meanwhile, might track hours billed by client and by project.
Here is a comparative table of the essential elements to include in an accounting tracking spreadsheet according to the type of business:
Key components of an Excel accounting tracking spreadsheet
The table below presents the various essential elements to include in an accounting tracking spreadsheet according to the size and type of business:
| Component | Micro-business/Sole trader | SME | Large company | Main function |
|---|---|---|---|---|
| Cash flow tracking | Simple (in/out) | Detailed by category | Multidimensional | Control financial flows |
| Income statement | Quarterly | Monthly | Weekly | Measure profitability |
| Pivot tables | Basic | Intermediate | Advanced | Analyze data from different angles |
| Intermediate management balances | Simplified | Complete | Detailed by division | Assess economic performance |
| VAT tracking | Manual | Semi-automated | Automated | Anticipate tax filings |
| Visual indicators | Simple charts | Dashboards | Interactive dashboards | Facilitate decision-making |
| Forecasting | Annual | Quarterly | Monthly and annual | Anticipate financial changes |
Building your tracking spreadsheet step by step (even without expertise)

Do you think creating an Excel accounting tracking spreadsheet is reserved for experts? Think again! Even without in-depth knowledge of spreadsheets, you can build an effective tool to manage your finances. A well-designed spreadsheet will not only let you track your accounts accurately, but also save you valuable time in your day-to-day management.
Defining the objective and key indicators
Before diving into Excel, take the time to think about what you really want to measure. Do you want to track your monthly revenue? Analyze your expenses by category? Calculate your margins? Once this objective is clear, identify the key performance indicators (KPIs) that will help you measure your success. For example, to assess your profitability, you might choose revenue, cost of goods sold and gross margin as KPIs.
Structuring the spreadsheet and organizing the data
Good organization is the key to an effective spreadsheet. Create different sheets if necessary: one for income, one for expenses, one for the general balance sheet. Use simple, precise titles for each column and row. Don’t hesitate to use conditional formatting to make your spreadsheet more readable — a well-thought-out color code (red for negative figures, green for positive ones) greatly facilitates quick data analysis.
Integrating formulas and automating calculations
Excel’s power lies in its formulas. Even the most basic ones will save you considerable time. Use SUM to automatically add up your monthly income, AVERAGE to calculate your average expenses, or percentage formulas to track the evolution of your indicators. These automations not only reduce your workload, but also considerably limit the risk of calculation errors.
Creating charts to visualize the data
A good chart is worth a thousand numbers. Turn your data into compelling visual representations using Excel’s charting features. A line graph will clearly show the evolution of your revenue over the months, a bar chart will effectively compare your results by quarter, and a pie chart will perfectly illustrate the breakdown of your expenses. The accounting dashboard is a highly valued tool in many sectors. For example, in France, construction companies frequently use these spreadsheets to optimize their management. In 2024, the Fédération Française du Bâtiment (FFB) even made a dashboard template available to its members.
Testing and adjusting the spreadsheet
Once your spreadsheet is created, don’t rush. Test it with your real data to check that the formulas work correctly and that the charts display information consistently. Don’t hesitate to modify the structure or calculations if needed. The goal is to create a tool you’ll use regularly, not a complex document that will end up forgotten. Also consider adding explanatory comments — they’ll be useful if you share your spreadsheet with your accountant or colleagues.
Automating to free up your time and potential
Devoting more time to financial analysis than to simple data entry is essential for any business. Automating your Excel accounting tracking spreadsheet turns a simple spreadsheet into a genuine financial assistant that supports you every day.
Automatically importing and categorizing your data
Imagine a system where your bank statements flow directly into Excel without manual intervention. Thanks to macros and VBA (Visual Basic for Applications), this feature becomes accessible to everyone. No more tedious copy-pasting of hundreds of lines, the risk of error decreases considerably and you save valuable time.
By defining custom rules, your spreadsheet can also automatically categorize your transactions. For example, all payments to your energy provider can be instantly classified under “Expenses - Energy.” This automatic organization gives you a clear and structured view of your business expenses.
Generating custom reports in one click
Once your data is organized, creating reports becomes remarkably simple. In just a few clicks, you can produce VAT returns, financial statements or income statements essential to your management.
Automation also allows you to tailor these reports to your specific needs. Want to analyze your expenses by month, category or project? These options are easily accessible thanks to the power of Excel’s automated functions.
Scheduled alerts to anticipate deadlines
Forget manual reminders and costly oversights. Your spreadsheet can now automatically alert you before important deadlines such as invoice payments or tax filings.
Receiving a notification a few days before a critical date lets you anticipate and avoid late penalties. Your tracking spreadsheet becomes a genuine steering tool that helps you maintain rigorous, stress-free financial management.
Dynamic dashboards for a real-time view
Automation also makes it possible to create dynamic dashboards that instantly reflect the state of your finances. Thanks to charts and indicators updated in real time, you immediately visualize the evolution of your revenue, the breakdown of your expenses and your overall profitability.
Excel accounting dashboard templates are numerous and adaptable to different types of businesses. They generally include key performance indicators such as accounts receivable and payable, income and expenses, as well as various financial ratios. In France, these tools are widely used to optimize financial management and make informed decisions. Discover more information on accounting dashboard templates.
By automating your Excel accounting tracking spreadsheet, you not only save time, you also improve your peace of mind and professional efficiency. This lets you focus on in-depth data analysis and strategic decision-making to grow your business. Solutions like Bizyness offer powerful automation features that considerably simplify accounting management for small businesses and sole traders.
Turning your numbers into impactful visual insights

Your Excel accounting tracking spreadsheet represents much more than a simple collection of data. It can become a genuine goldmine of visual information that tells your company’s financial story. Data visualization lets you quickly grasp trends and make informed decisions without getting lost in the numbers.
The art of visualization: revealing charts
A well-structured spreadsheet is a solid foundation, but it’s the charts that truly bring your data to life. Suitable charts instantly turn columns of figures into understandable information. For example, a trend line can highlight the peaks and troughs of your annual revenue, letting you immediately identify periods of strong activity and slowdown.
These visual representations make it easier to detect anomalies and opportunities that would remain invisible in a simple table of figures.
Visual dashboards: an instant overview
For even more effective analysis, visual dashboards become indispensable. By integrating conditional indicators that change color based on values, custom gauges to visualize goal achievement, or heat maps to spot critical points, you greatly simplify data interpretation.
Imagine a dashboard where a light turns red as soon as your expenses exceed your budget, alerting you immediately. These visual tools give you a clear, instant overview of your company’s financial health, without having to analyze every line of data.
Dynamic comparisons: analyzing performance
Meaningful analysis of your performance requires comparisons with previous periods and your strategic objectives. Excel lets you create dynamic comparisons using pivot tables and comparative charts. This lets you juxtapose your current results with those of the previous month or year, or measure your progress against set objectives.
These features give you concrete means to assess the effectiveness of your actions and adjust your strategy based on the results obtained.
Here is an overview of the different financial visualizations you can create in Excel:
Types of financial visualizations in Excel
| Indicator type | Recommended visualization | Advantages | Disadvantages | Application example |
|---|---|---|---|---|
| Sales evolution | Line chart | Clearly shows trends over time | Less effective for comparing multiple categories | Monthly revenue tracking |
| Expense breakdown | Pie chart | Intuitive visual of proportions | Hard to read with too many segments | Breakdown of fixed and variable costs |
| Budget comparison | Bar chart | Facilitates comparison between values | Limited for showing change over time | Planned vs. actual by expense category |
| Profitability analysis | Combo chart (columns and lines) | Allows displaying two types of data | Can be complex to interpret | Revenue and margin by product |
| Performance indicators | Gauges and traffic lights | Immediate visual impact | Limited in terms of detailed information | Dashboard of main KPIs |
These visualizations let you tailor your financial tracking to each type of indicator while maximizing the clarity and impact of your analyses.
Concrete examples and practical applications
These visualization techniques adapt to all business sectors. A restaurant owner can use a chart to identify their most profitable dishes. An e-commerce seller can analyze the origin of their sales with a pie chart. A consultant can visualize the breakdown of their time by client using a bar chart.
Excel’s adaptability and powerful visualization features make it possible to create relevant accounting tracking spreadsheets, whatever your business.
A tool like Bizyness simplifies this process even further by automating certain tasks and offering pre-configured dashboards for small businesses and sole traders. By combining Excel with Bizyness’s features, you gain efficiency and precision in your financial management, letting you focus on strategic analysis and growing your business.
Overcoming obstacles and optimizing performance

An Excel accounting tracking spreadsheet can become complex as your business grows. Let’s look together at the common challenges and concrete solutions to maximize the effectiveness of your accounting tracking tool.
Managing large volumes of data
Managing large amounts of data is often the first obstacle. An overloaded Excel file quickly becomes slow and difficult to work with. To solve this problem, a few adjustments are needed.
- Structuring the data: Spread your information across several distinct but connected sheets. For example, create one sheet for sales, another for purchases, and one dedicated to cash flow.
- Simplified formulas: Opt for direct formulas and avoid complex arrays that slow down your system. Pivot tables make it easier to analyze large volumes without bloating the file.
- Effective filtering: Use filters and sorting to quickly access the information you’re looking for. Slicers let you display only the data relevant to your current analysis.
These technical improvements make your Excel accounting tracking spreadsheet run more smoothly, even as the amount of information increases considerably.
Ensuring the security of sensitive data
Protecting your accounting information is essential. Excel offers several features to effectively secure your data.
- Encryption: Password-protect your file to restrict access to authorized people only.
- Differentiated rights: Set specific permissions for each user (view only, edit allowed, etc.).
- Systematic backups: Set up automatic backups on external storage or in the cloud to avoid any loss in case of an incident.
These simple but rigorous measures protect your data and preserve the confidentiality of your financial information.
Facilitating collaboration and sharing
Your Excel accounting tracking spreadsheet can become a genuine collaborative tool. Several methods can improve sharing with your team and your accountant.
- Online sharing: Use platforms like OneDrive or Google Drive to share your file with your colleagues in real time.
- Change history: Enable change tracking to easily identify who modified what and when.
- Notes and comments: Include remarks directly in the file to clarify certain entries or ask questions.
These features turn your Excel spreadsheet into a shared workspace, making communication about your accounting data more direct and efficient.
Alternative solutions to optimize performance
Despite all these optimizations, Excel can reach its limits when faced with more complex accounting needs. Solutions like Bizyness offer more advanced, automated features. The slowdowns caused by large files, the complexity of formulas or the difficulty of adjusting budgets — problems identified by TSS Performance — can be solved with specialized software.
Bizyness is a particularly well-suited alternative for sole traders and small businesses. Automated invoicing, simplified VAT management and bank synchronization considerably lighten day-to-day accounting tracking. Discover Bizyness today and focus on growing your business rather than on Excel’s technical constraints.
