

 Français
How to Calculate Business Profitability: Optimize Your Margins and Drive Growth
Learn how to calculate business profitability with simple formulas and real examples to steer your activity and boost your margins.

Calculating your business’s profitability simply means checking whether it earns enough money to cover all its expenses and, of course, generate a profit. You could say it’s the true indicator of financial health. It’s far more revealing than revenue alone, because it measures the real efficiency of your business model.
Why mastering your profitability is a matter of survival

More than just a figure in a spreadsheet, profitability is the pulse of your business. For a freelancer or a small structure, an accurate calculation becomes the best steering tool. It turns raw data into clear, informed decisions.
This analysis helps you answer fundamental questions about your growth:
- Set fair prices that cover your costs and secure your margin.
- Identify the offers that are most profitable, and those that, on the contrary, drain your resources.
- Anticipate hard times by knowing precisely the minimum revenue you need to reach to stay out of the red.
The underlying idea is simple: understand that revenue doesn’t tell the whole story. A company that brings in a lot but spends even more is on very slippery ground. Moreover, mastering the numbers isn’t always enough. In an increasingly connected world, a good understanding of cross-cultural communication in business can also be a major asset, helping you avoid costly misunderstandings and explore new markets.
An economic climate that calls for caution
The current situation in France is paradoxical: many business creations, but increasingly strong pressure on margins. Cash-flow tensions are widespread, and some observatories forecast a rise in business failures, which could reach around 69,000 cases in 2025. This climate makes calculating profitability even more vital to limit risk.
In a market where every euro counts, rigorous profitability tracking is no longer optional. It’s a condition for survival.
Fortunately, you no longer have to do everything by hand. Modern tools like Bizyness can automate these calculations, freeing up precious time so you can focus on what matters: growing your business with peace of mind.
The profitability indicators you really need to know
To know whether your business is on the right track, looking only at revenue is a bit like driving while watching only the speedometer. It doesn’t tell you if you’re heading for a wall. The calculation of a company’s profitability relies on a few key indicators that, once mastered, become your true dashboard.
Let’s dive together into the numbers that really matter.
Gross margin vs. net margin: two different stories
To get started on the right foot, you absolutely need to distinguish between gross margin and net margin. They don’t tell the same story, but one without the other is an incomplete picture.
Gross margin is your first performance indicator, the one that tells you whether your core business is healthy. Concretely, it measures the direct profitability of your products or services.
Calculating it is simple: you take your revenue and subtract all the costs directly tied to what you sold (purchase of goods, raw materials, etc.).
Simple formula: Revenue - Cost of goods sold
Let’s take a concrete example: a craftsperson who sells a handmade lamp for €100. If the wood, cable and bulb cost them €30, their gross margin is €70. It’s an excellent way to know whether your selling price is properly set relative to the cost of each product.
Incidentally, to go further, analyzing the gross margin rate is an almost mandatory step to assess the individual performance of your products.
Now let’s move on to net margin. This is the ultimate arbiter, the figure that tells you what’s really left in your pocket at the end of the month. It takes into account absolutely all your expenses: your workshop rent, your contributions, software subscriptions, marketing, fuel… everything.
Simple formula: Net profit / Revenue
A net margin of 15% means that out of €100 billed to a client, €15 remains as pure profit once everything is paid. It’s the ultimate indicator of your company’s overall profitability. To dig deeper into this topic, our guide on calculating margin is an excellent resource.
Economic and financial profitability: the strategic view
Once margins are understood, you can move up a level with two other ratios that offer a more strategic view.
Economic profitability (also known as ROA, for Return on Assets) tells you whether you’re making good use of your equipment to earn money. It answers the question: “Are my work tools (computer, machine, vehicle) efficient at generating profit?”
A high ROA is a sign that you’re optimizing your investments. Every euro spent on equipment is actively working for you.
Finally, financial profitability (ROE, Return on Equity) is the ratio investors love, but it’s just as crucial for you, the business owner. It measures the return on the money you personally put into your company (your starting capital, your contributions). Put simply: “Is the money I invested in my project earning me more than if it had stayed in a savings account?”
In the current context, keeping an eye on these numbers matters more than ever. A recent study showed that 78% of small and medium businesses considered their profitability good in 2022, a figure down from 83% in 2019. This clearly shows that margin pressure is a reality for many entrepreneurs.
To help you see things more clearly, here’s a summary table of these four pillars of profitability.
The 4 profitability indicators explained
This table summarizes the main indicators, their formula, and what they concretely reveal for a small structure like yours.
| Indicator | Simple calculation formula | What it reveals about your business |
|---|---|---|
| Gross Margin | Revenue - Direct sales costs | Measures the profitability of your products/services before fixed costs. Essential for setting your prices. |
| Net Margin | (Net profit / Revenue) x 100 | Shows the actual profit left after paying everything. This is the true indicator of overall health. |
| Economic Profitability (ROA) | Net income / Total assets | Assesses how efficiently your tools (machines, equipment) generate profit. |
| Financial Profitability (ROE) | Net income / Equity | Indicates whether the money you personally invested in your business is “working” well for you. |
Keeping these four indicators in mind gives you a 360° view of your business’s performance, well beyond simple revenue.
Defining your break-even point to steer with confidence
Knowing your break-even point is a bit like having a compass for your business. It’s the exact revenue you need to reach to cover all of your expenses. No more, no less. It’s the tipping point where you stop losing money and, finally, start earning it.
This indicator is fundamental to calculating your company’s profitability. It turns a simple hunch into a tangible, and above all motivating, numeric goal. But before pulling out the calculator, there’s a crucial step: putting your expenses in order.
The key: clearly distinguish fixed costs from variable costs
Any serious financial analysis rests on this distinction. It’s the foundation that will make your calculations reliable.
Fixed costs are all those expenses that fall due every month, whether your order book is bursting at the seams or desperately empty. It’s the cost of “keeping the shop open.”
- The rent for your office or workshop.
- Your software subscriptions (accounting tool, creative suite, marketing platform…).
- Business insurance (professional liability, multi-risk…).
- Salaries and payroll taxes, if you have a team.
By contrast, variable costs move in step with your activity. The more you sell, the more they rise. Simply put, they’re directly tied to producing what you sell.
- Purchasing raw materials for a craftsperson.
- Shipping costs for an online seller.
- Commissions taken on each sale by a platform or a business referrer.
Once you’ve clearly separated these two types of costs, everything becomes clearer. The path to profitability follows a logical flow: sales generate revenue that first goes toward covering costs before finally turning into profit.
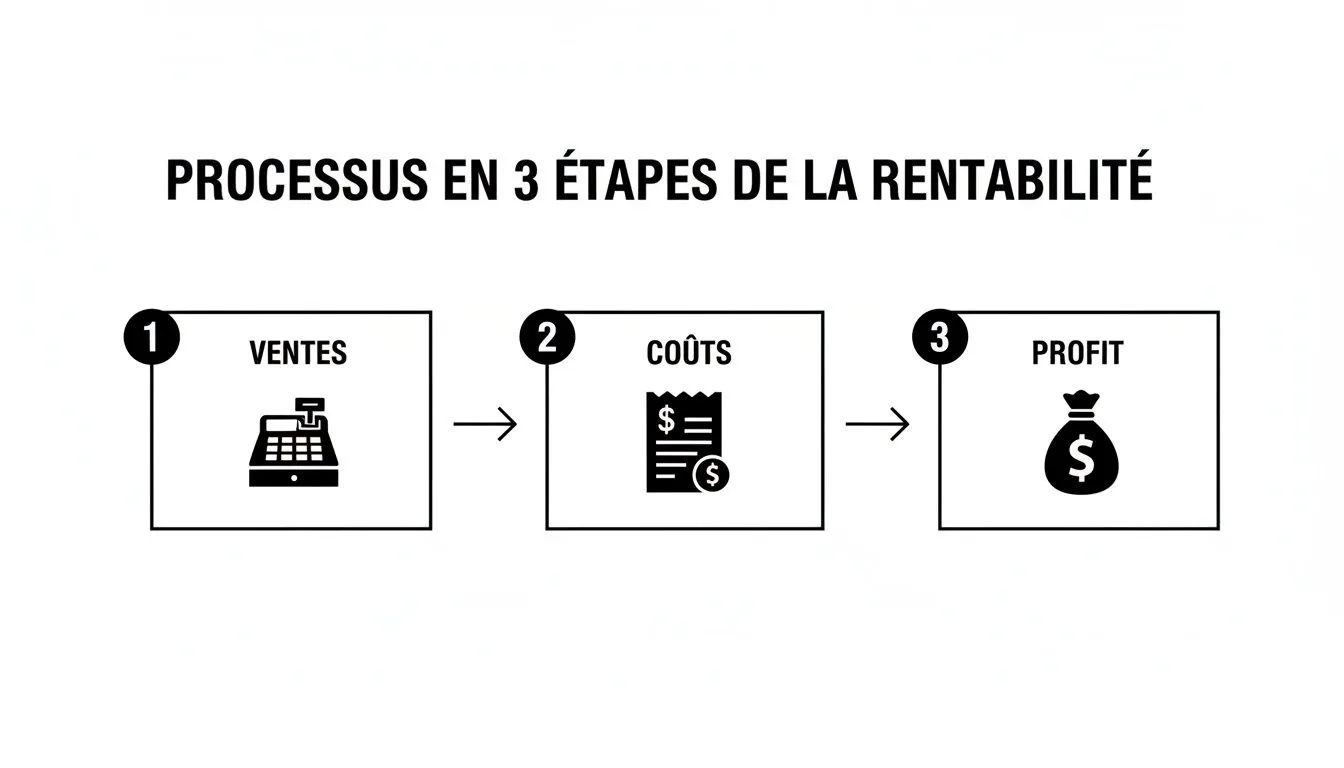
This diagram makes it clear: profit is nothing more than the result of a controlled balance between what comes in (sales) and what goes out (costs).
The break-even formula, put into practice
To calculate this famous threshold in euros, the most direct formula is as follows:
Break-even point (€) = Annual Fixed Costs / Contribution Margin Ratio
And how do you get this Contribution Margin Ratio? Simply with this calculation: (Revenue - Variable Costs) / Revenue.
Let’s imagine a jewelry designer who sells her creations online. Her annual fixed costs (rent for her small workshop, Shopify and Canva subscriptions, professional insurance) amount to €12,000. Last year, she generated revenue of €50,000. To achieve this, she spent €20,000 on raw materials (beads, silver), packaging and shipping costs – her variable costs.
- First, we calculate her contribution margin ratio: (€50,000 - €20,000) / €50,000 = 0.6.
- Then, we apply the break-even point formula: €12,000 / 0.6 = €20,000.
Conclusion? She needs to generate €20,000 in revenue for her business to cost her nothing. Every euro sold beyond that threshold is pure profit. To go further, our complete guide on calculating the break-even point will give you more tips and examples.
From break-even point to break-even date: a matter of timing
Knowing how much to sell is good. Knowing when you become profitable is even better! That’s where the break-even date comes in. It translates the break-even point into a duration, usually expressed in number of days.
The formula is quite simple: Break-even date (in days) = (Break-even point / Annual Revenue) x 365.
Let’s take our jewelry designer’s example again: (€20,000 / €50,000) x 365 = 146 days.
This means she starts becoming profitable from the 147th day of the year onward, around May 27. In concrete terms, before that date, every sale goes toward paying off her expenses. After it, every sale boosts her profit. It’s a fantastic steering tool that gives a clear target and a real boost to reach it.
How to concretely calculate the profitability of your business

Formulas and ratios are one thing. But for them to truly make sense, you need to confront them with the reality of your daily life. It’s by analyzing profitability calculation through concrete examples that theory turns into a powerful decision-making tool.
To fully understand this, let’s break down two scenarios you may be familiar with: a freelance marketing consultant and a sole trader selling online.
Case 1: The marketing consultant and her net margin per assignment
Let’s take the example of Anaïs, a marketing consultant. She has just wrapped up an assignment she billed at €4,000 excl. VAT. To know what’s really left in her pocket, she obviously can’t rely solely on that revenue figure.
First, she needs to list all the variable costs directly tied to this project:
- Subcontracting: She outsourced the creation of an infographic to a graphic designer, who billed her €300.
- Travel: Several round trips to her client’s office cost her €50 in transport.
Her total variable costs for this assignment therefore amount to €350. But the analysis doesn’t stop there. Anaïs also has monthly fixed costs, and to get an accurate picture, she needs to allocate a portion of them to each project.
Her monthly fixed costs of €500 break down as follows:
- Coworking space: €250
- Software subscriptions (CRM, creative suite): €150
- Professional liability insurance: €50
- Business banking fees: €50
If this assignment took up half of her working time for the month, it’s entirely logical to allocate 50% of her fixed costs to it, i.e. €250. The total cost of the assignment is therefore €350 (variable) + €250 (fixed), giving us €600.
Her net profit on this assignment is €4,000 - €600 = €3,400. Her net margin then reaches 85% (€3,400 / €4,000). This concrete figure lets her immediately judge whether her rates are properly aligned with the effort involved and the costs she incurs.
Case 2: The online seller and their customer acquisition cost
Let’s now move on to Léo, who sells online courses through his website. For him, the big challenge isn’t inventory management, but making sure his ad campaigns are profitable.
Last month, he invested €1,000 in social media ads. This campaign brought in 50 new customers. His customer acquisition cost (CAC) is therefore simple to calculate: €1,000 / 50 = €20 per customer.
Each course sells for €97. From this amount, he needs to deduct his variable cost per sale, which here is the payment platform’s fee (around 3%), i.e. €2.91. His gross margin per sale is therefore €97 - €2.91 = €94.09.
Subtracting the acquisition cost, the real profit per customer is €94.09 - €20 = €74.09. For his 50 customers, that represents a profit of €3,704.50. It’s an excellent result, but for rigorous tracking, he also needs to factor in his fixed costs (website hosting, emailing service…).
All these financial elements come together in one essential document: the income statement. To better understand how to organize this information, feel free to check out our income statement template.
This detailed analysis, which goes well beyond simple revenue, is crucial. In fact, studies show that profitability can vary enormously depending on sector and even geography. Insee, for instance, highlighted that the margin rate for some SMEs in French Guiana reached 8.4% compared to 6.6% in mainland France. A fine illustration of the importance of adapting the analysis to your own cost structure.
Common mistakes that skew your profitability calculations
Even with the right formulas in hand, a small oversight or a bad habit can completely distort your view of profitability. The good news is that these pitfalls are well known and easy to avoid once you know where to look. Think of this section as a small checklist to make sure your numbers accurately reflect reality.
Because profitability analysis is a bit like a recipe: if one ingredient is mismeasured or poorly chosen, the final result isn’t what you expected. To steer your business with confidence, your data needs to be flawless.
Forgetting your own compensation
This is by far the most common mistake, especially when starting out as a freelancer or micro-entrepreneur. You spend hours on your project, that time has value, and it absolutely must be counted as a cost. Failing to plan for compensation, even if it’s not paid out at first, creates a false impression of profitability.
Pro tip: Set yourself a realistic monthly salary, even if you decide not to take it during the first few months. Include this amount in your fixed costs. It forces you to build a viable long-term business model, one capable of supporting you.
Misclassifying costs (fixed vs. variable)
Mixing up fixed and variable costs is a guarantee of a completely off-target break-even point. A typical example? Treating a software subscription as a variable cost. Whether you make 10 sales or none, that subscription bill will still come due.
To never get it wrong again, ask yourself a simple question for each expense: “If I sell absolutely nothing next month, do I still have to pay this bill?”
- If the answer is yes, it’s a fixed cost.
- If it’s no, it’s a variable cost.
It’s as simple as that. This distinction is crucial, because a poor classification will give you an incorrect break-even point, and therefore sales targets completely disconnected from reality.
Keeping your eyes glued to revenue
Revenue is a volume indicator, not a financial health indicator. You can very well generate impressive revenue and still lose money by the end of the month. It’s the classic “spinning your wheels” syndrome: lots of activity, but no profit.
Your true compass, the one that should guide your decisions, is net margin. This is the indicator that tells you what’s really left in your pocket once all the bills are paid.
Thinking in terms including VAT and forgetting about VAT
Ah, VAT… an essential point of vigilance. The money you collect on behalf of the government is only passing through your accounts, it doesn’t belong to you. A beginner’s mistake is calculating profitability based on amounts including VAT.
Get into this habit right now: all your management calculations should be done on an excluding-VAT basis.
- Use your revenue excluding VAT.
- Factor in your costs and purchases excluding VAT.
By doing this, you avoid cold sweats at VAT return time and ensure your margins reflect what you’re actually earning. By avoiding these few pitfalls, your profitability calculation will become a powerful ally for making the right decisions and steering your business with clarity.
Your questions, our answers on profitability
Diving into profitability calculations is a bit like popping the hood of your car: you know it’s important, but it can quickly become intimidating. To help you avoid getting lost in the details, I’ve gathered here the questions that come up most often among the entrepreneurs I work with.
How often should I calculate my profitability?
Ideally? A monthly review. This discipline gives you near-instant responsiveness. You spot a cost overrun or an eroding margin before the problem takes hold, allowing you to correct course without delay.
If your schedule is really tight, consider a quarterly review the bare minimum. It’s not so much the perfect frequency that matters, but consistency. This regularity is what lets you spot trends forming, anticipate hard times, and steer your business with confidence.
Thinking you can run a business without knowing its profitability is like flying a plane without a dashboard. Regular tracking is your best compass for staying on course toward your goals.
How can I improve my profitability without raising my prices?
Touching your rates is often the easy way out, but rarely the best one. Fortunately, you have other cards to play to give your margins some breathing room.
- Work on your variable costs. Have you tried renegotiating with your suppliers? Looked for less costly alternatives for your raw materials or logistics? Every cent saved here is a cent that goes straight into your pocket.
- Streamline your fixed costs. Take the time to sort through your subscriptions. That software you pay for every month, do you actually use it? Is your phone plan suited to your real needs? These small savings, added together, make a real difference.
- Optimize your productivity. Identify repetitive tasks that eat up your precious time and automate them. This will free up time for what really matters: selling, innovating, and taking care of your customers.
What’s the difference between profitability and cash flow?
This is a classic point of confusion, but the distinction is absolutely crucial to your company’s survival. These are two complementary indicators, but they tell completely different stories.
Profitability measures the health of your business model. It answers the question: “On paper, am I making money?” A profitable business has a concept that holds up.
Cash flow is the money you actually have in your bank account, right here, right now. It’s the oxygen of your business, what lets you pay salaries, suppliers, and bills.
You can be perfectly profitable on paper (your invoices show nice margins) and still be forced to close shop because your clients pay you on 90-day terms and you no longer have the cash to keep going. Monitoring both is therefore non-negotiable.
Going from theory to concrete numbers can quickly become a headache. To make life easier, Bizyness automates these calculations and gives you a clear, real-time view of all your indicators. Make decisions based on facts, not hunches. Discover how our tool can help you steer your business.
