

 Français
A practical income statement example to steer your business
Discover a practical income statement example and learn to read, analyze and use this document to steer your business.

An income statement is, simply put, a summary of what your business earned (its revenue) and spent (its expenses) over a given period. It highlights the final result: a profit or a loss. It’s essentially the financial story of your performance, told in a single document.
The income statement explained with a simple analogy
To understand it well, picture your business as a marathon runner. The balance sheet is a snapshot taken right before the start: it shows the runner’s gear (assets) and what they owe (liabilities).
The income statement, on the other hand, is the film of the race. It traces the entire performance over the period, say a full year. It shows the energy spent running (expenses) and the distance covered (revenue).
At the finish line, the net result tells you whether the runner succeeded and reached their goal. This document is therefore essential for any entrepreneur, from freelancer to small business, because it tells the true story of their economic performance.

Turning numbers into strategic decisions
The income statement is much more than a simple administrative obligation. It’s a genuine dashboard for steering your business. By analyzing it, you can answer questions that are crucial for the future:
- Profitability: Is my business really viable? Does my revenue cover all my expenses, including the least visible ones?
- Cost management: Which expense categories weigh the most? Where can I save money without affecting the quality of my products or services?
- Investment opportunities: Can I really afford to buy this new equipment, hire someone, or launch this marketing campaign?
In France, the income statement is a key document that follows a very specific structure, defined by law. This standardization helps entrepreneurs easily read and understand their financial situation. To dig deeper into the topic, you can check out this more detailed article on the income statement.
The true health record of your business
Let’s continue with our analogy. If the income statement is a health record, the net result is the final diagnosis: “in great shape” (profit) or “needs monitoring” (loss).
But a good doctor never stops at the diagnosis. They look at every line of the health record to understand why the patient is in that state.
The income statement gives you exactly that power. A large profit isn’t always a sign of long-term success, and a loss isn’t necessarily a disaster if it’s explained by a major investment for the future.
This fine-grained analysis gives you the keys to anticipate, adjust your strategy and make better decisions. By mastering this tool, you stop simply “doing your books”: you steer your business proactively. You move from reactive management to a genuinely mastered strategy.
The structure of the income statement broken down
To approach an income statement without feeling overwhelmed, picture it as one big subtraction, but organized in tiers. You start at the top with revenue, then work your way down, step by step, deducting the various expenses to see what’s left at each level.
This progressive approach tells a story: that of your business’s profitability. The whole structure rests on two fundamental pillars: revenue (everything that comes in and enriches the business) and expenses (everything that goes out and depletes it). Their difference gives the final result.
Let’s see how these two big families come together to give us a clear financial narrative.
Revenue: the fuel of your business
Revenue is the set of resources your business generates over a given period. It’s simply the oxygen that fuels your business model.
- Operating revenue: This is the heart of the engine. It mainly includes your revenue (turnover), i.e. the sum of all your sales of goods or services. For an e-commerce store, this means sales of your items. For a consultant, it’s the fees you invoice.
- Financial revenue: This is income that doesn’t come from your core activity, but from your investments. If you have idle cash sitting in an interest-bearing account, the interest earned is financial revenue.
- Non-recurring revenue: As the name suggests, this is rare and disconnected from your day-to-day activity. Imagine selling an old desktop computer you no longer use; the small gain you make on it is non-recurring revenue.
Adding up these three items gives you the total resources generated. But to know whether you’re truly performing well, you now need to look at what all this cost you.
Expenses: the price to pay to create value
Expenses are all the costs needed to run the business. To make the comparison easy, they’re classified the same way as revenue.
- Operating expenses: These are all the recurring costs directly tied to your core business. For an e-commerce site, this ranges from purchasing the goods you resell to Facebook advertising costs, plus your Shopify subscription and shipping costs. For a freelance developer, it will be software subscriptions or a subcontractor’s fees.
- Financial expenses: These essentially correspond to the interest you repay on a bank loan.
- Non-recurring expenses: Again, these are unusual and unforeseen costs, like a tax fine or a penalty following a dispute.
The whole logic of the income statement is to methodically subtract these various expenses from the corresponding revenue.
To help you visualize this, here’s a simple summary of the structure.
Simplified structure of an income statement
This table presents the main components of an income statement, clearly distinguishing revenue and expenses to arrive at the net result.
| Category | Description | Concrete examples (for small businesses/freelancers) |
|---|---|---|
| Operating revenue | Income generated by the business’s main, recurring activity. This is your revenue (turnover). | Invoices sent to clients, sales on an e-commerce site, consulting fees. |
| Operating expenses | Recurring costs needed to generate operating revenue. | Purchase of goods, rent, salaries, advertising costs, software subscriptions (CRM, accounting…). |
| Financial revenue | Income from investments and cash management. | Interest earned on a business savings account, dividends received from shares. |
| Financial expenses | Costs related to financing the business, mainly debts. | Interest on a bank loan, bank fees on an overdraft. |
| Non-recurring revenue | Non-recurring gains unrelated to normal business activity. | Sale of an old company vehicle, insurance payout following an incident. |
| Non-recurring expenses | Unusual, unpredictable expenses unrelated to operations. | Tax fine, late penalties, legal fees. |
| Net result | (Total revenue - Total expenses) - Taxes. This is the final profit or loss. | The number that tells you whether you made or lost money over the period. |
This breakdown lets you go beyond the final result to understand how you got there. That’s where the well-known intermediate balances come in.
Intermediate balances: the key steps in the calculation
You don’t go directly from revenue to net profit. The calculation is done in tiers, called intermediate management balances. These are a bit like chapters in a book: each one reveals crucial information about your performance.
Think of these intermediate balances as checkpoints in a race. Each checkpoint gives you different information: your speed, your fatigue level, your lead over competitors. They let you know not only whether you’re going to win, but also how you’re running the race.
Here are the most important ones to know for a small business:
- Trading margin: Essential for buy-resell activities, it measures the gross gain made on sales of goods (selling price - purchase cost).
- Gross operating surplus: This is probably the most telling indicator. It shows the cash generated by your core business, even before factoring in your investment policy (depreciation) or financing (loan interest). A positive gross operating surplus is an excellent sign of health.
- Operating result: This measures the pure performance of your business, this time including depreciation charges (which represent the wear of your equipment, such as a computer or a vehicle).
- Net accounting result: This is the finish line. Once financial and non-recurring results are taken into account, and corporate tax is paid, you get the final profit or loss. This is the number that tells you whether, by the end of the year, the business has actually grown richer or poorer.
Every line of your income statement example is therefore more than just a number. It’s a piece of the puzzle that, once assembled, gives you a clear and dynamic view of your profitability.
Nothing beats practical cases to really understand this. Theory is one thing, but seeing how the numbers play out in reality is far more telling. That’s why we’ve prepared three income statement examples, each tailored to a specific type of business.
Think of these examples not as simple tables, but as mini case studies. For each situation, we’ll break down the key figures and see what they tell us about the health of the business. This is the kind of analysis that really helps you make the right decisions.
Case 1: The income statement of a freelance consultant
Let’s start simple, with a digital marketing consultant working solo, under the sole trader (micro-entrepreneur) regime. Their cost structure is very light: no stock, few fixed costs. Their main challenge? Making sure their invoices cover their expenses and social contributions, while leaving them a comfortable income at the end of the month.
Simplified income statement – Marketing consultant (Year N)
| Line item | Amount (€) | Analysis |
|---|---|---|
| Operating revenue | ||
| Revenue (Fees) | 50,000 | The sole source of income, coming from invoiced assignments. |
| Total revenue | 50,000 | |
| Operating expenses | ||
| Software subscriptions (CRM, SEO…) | - 2,400 | Recurring but essential costs for their business. |
| Subcontracting fees (writer) | - 5,000 | A cost that varies with their workload. |
| Professional bank fees | - 360 | A small fixed cost, often overlooked by freelancers. |
| Social contributions (URSSAF) | - 11,000 | About 22% of revenue, by far their biggest expense. |
| Total expenses | - 18,760 | |
| Operating result | 31,240 | What’s left before tax. The fruit of their expertise. |
| Income tax (flat-rate withholding) | - 1,100 | A convenient tax option for micro-entrepreneurs. |
| Net result | 30,140 | The final profit, which represents their real income. |
This income statement is very clear: for revenue of €50,000, the consultant pockets €30,140. Their expenses represent 37.5% of what they invoiced, which is a perfectly sound ratio for a service business. The lesson to remember: the weight of social contributions is enormous and must absolutely be anticipated.
Case 2: The income statement of an e-commerce store
Let’s completely change scenery. Here’s a small online store selling fashion accessories. Here, the largest expense categories are completely different. You need to closely monitor purchases of goods and advertising budgets.
In e-commerce, revenue doesn’t tell the whole story. The real challenge is keeping control of the acquisition cost of each customer and preserving your margin on each product sold. The income statement is the perfect tool for monitoring this delicate balance.
Simplified income statement – E-commerce store (Year N)
| Line item | Amount (€) |
|---|---|
| Operating revenue | |
| Sales of goods | 120,000 |
| Total revenue | 120,000 |
| Operating expenses | |
| Purchase of goods | - 55,000 |
| Advertising costs (Google Ads, Meta) | - 15,000 |
| E-commerce platform subscription | - 1,200 |
| Transaction fees (Stripe, PayPal) | - 3,000 |
| Shipping and packaging costs | - 8,000 |
| Salaries and social contributions (1 person) | - 25,000 |
| Total expenses | - 107,200 |
| Operating result | 12,800 |
| Corporate tax (reduced rate) | - 1,920 |
| Net result | 10,880 |
Here, the first indicator to look at is the gross trading margin (Sales - Purchase of goods), which comes to €65,000. That’s a good start. But once all the other expenses are deducted, notably the €15,000 of advertising, net profit drops to €10,880. This income statement reminds us that every euro spent on advertising must be closely scrutinized to make sure it brings in more than it costs.
Case 3: The income statement of a self-employed plumber
Finally, let’s look at the case of a self-employed plumber running a small business. Their activity is a mix of selling equipment (such as boilers) and providing services (labor). Their expenses are therefore varied: purchases of supplies, but also costs related to their van and professional insurance.
This diagram sums up the logic well: you start from revenue, subtract all expenses, and arrive at the final result.
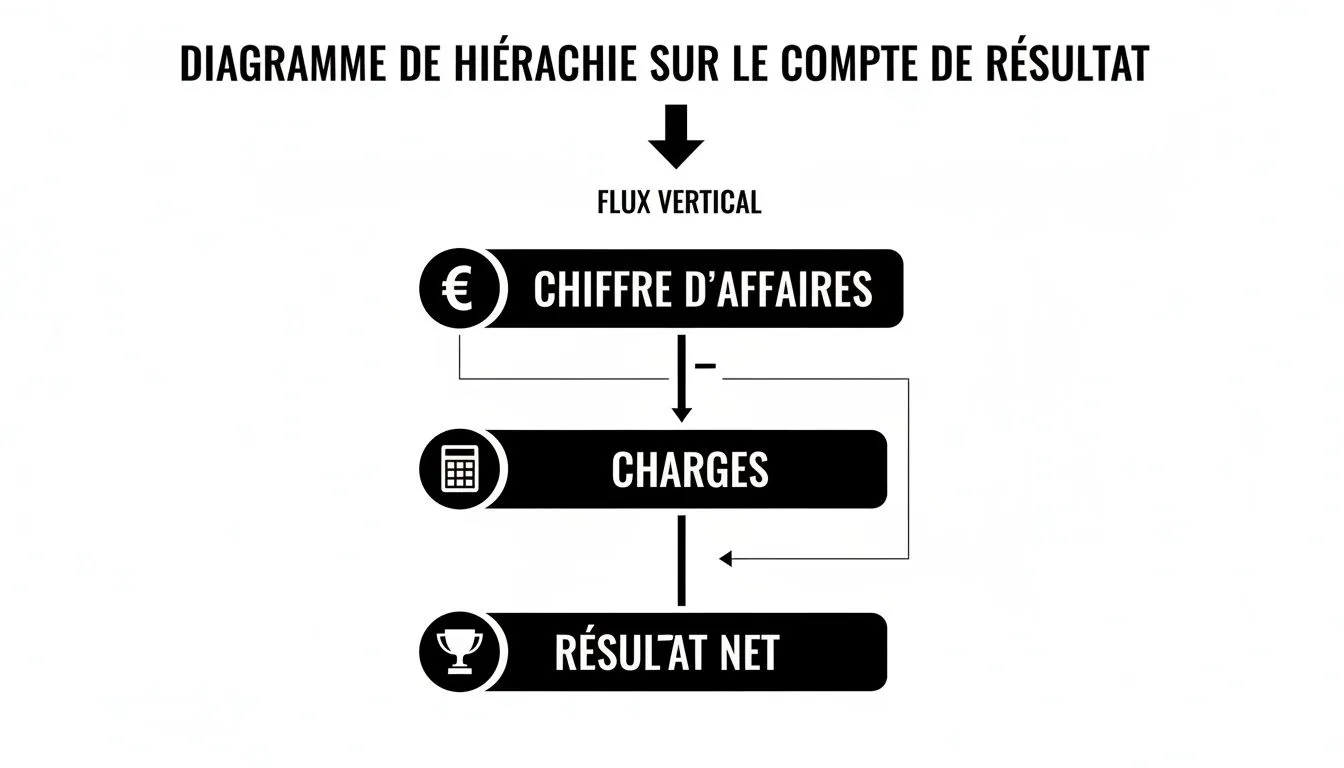
The image above perfectly illustrates the calculation. The result is simply the difference between what the business earned and what it spent to get there.
Simplified income statement – Self-employed plumber (Year N)
| Line item | Amount (€) |
|---|---|
| Operating revenue | |
| Services (labor) | 60,000 |
| Sales of equipment (boilers, etc.) | 25,000 |
| Total revenue | 85,000 |
| Operating expenses | |
| Purchases of supplies and equipment | - 18,000 |
| Fuel and vehicle maintenance | - 6,000 |
| Professional liability insurance | - 1,500 |
| Workshop rent | - 7,200 |
| Salaries and social contributions (1 apprentice) | - 15,000 |
| Total expenses | - 47,700 |
| Operating result | 37,300 |
| Corporate tax | - 5,595 |
| Net result | 31,705 |
This last example highlights the diversity of revenue sources. With a profit of €31,705, the business is solid. To go further, the plumber could analyze the profitability of equipment sales and services separately. This would let them know which part of their business is the most lucrative and adjust their strategy accordingly.
Of course, each of these models is a base you can adapt to your own situation. To get started, feel free to download our income statement Excel template and begin building your own financial analysis. These examples are an excellent starting point for better mastering your own numbers.
How to analyze your income statement to take action
Having an income statement in hand is great. It’s a bit like owning a detailed map of your financial territory. But a map is useless if you don’t know how to read it. The real challenge now is turning this table of numbers into a concrete action plan to steer your business.
To get there, two complementary approaches will make your data speak. The first is vertical analysis, which breaks down the structure of your costs. The second is horizontal analysis, which reveals trends over time. Combining both gives you a 360° view of your business’s performance.
Vertical analysis to identify key expense categories
Picture your revenue as a cake. Vertical analysis involves slicing this cake to see which expense takes the biggest piece. It’s a remarkably effective method for answering the question every entrepreneur asks: “Where is my money going?”
The technique is very simple. Just divide each expense category by your total revenue, then multiply the result by 100 to get a percentage.
Let’s take a concrete example: your e-commerce store generated revenue of €120,000. You spent €15,000 on advertising. The calculation is: (15,000 / 120,000) * 100 = 12.5%. This figure then becomes a key performance indicator (KPI) to monitor closely. Is this a good ratio? Is it growing faster than your sales?
By expressing each expense as a percentage of revenue, you create stable benchmarks. This lets you compare your performance from one year to the next, even if your activity volume has changed, or benchmark yourself against your industry averages.
This analysis highlights the structure of your costs and helps you make informed decisions. If purchases of goods account for 60% of your revenue, even a small negotiation with your suppliers will have a considerable impact on your profit. To dig deeper into this topic, our guide on calculating trading margin is an essential complement to this analysis.
Horizontal analysis to spot trends
If vertical analysis is a snapshot at a given moment, horizontal analysis is the film of your business. It simply involves comparing your current income statement with those of previous periods (year N-1, N-2, etc.). The goal? To spot changes, whether good or bad, and above all, to understand why they happened.
A sudden +20% rise in your overhead while your revenue only grew by 5% should immediately raise a red flag. It’s a drift worth investigating: is it due to a rent increase? A new software subscription you forgot about?
Tracking the evolution of your income statement is a crucial habit for entrepreneurs. Seeing how expenses and revenue evolve from one year to the next reveals underlying trends. For example, if your payroll goes from 35% to 45% of your expenses in a year, this 10-point shift could be explained by new hires, raises, or one-off bonuses.
Asking the right questions to move into action
Once these analyses have been carried out, the most important thing is to ask the right questions to turn these numbers into decisions. An income statement is useless if it doesn’t lead to a strategy.
Here are a few starting points for your thinking:
- Is my business model solid? Is your gross margin (the difference between your sales and the cost of your goods) enough to cover all your other expenses?
- Are my costs under control? Are there expenses that are drifting and growing faster than my revenue?
- Is my profitability improving? Is the ratio of net result to revenue improving from one year to the next?
- What are my levers for action? To boost my profit, is it better to increase my sales, reduce my customer acquisition costs, or optimize my overhead?
If you like to push the analysis into detail, especially with Excel, knowing how to use conditional sum functions is a real plus. For example, you could master advanced Excel formulas like SUMIFS to group and analyze your expenses by category almost automatically.
Common mistakes to avoid when preparing your income statement
Preparing a reliable income statement is an essential step, but the journey is often full of pitfalls. Even the most meticulous entrepreneurs can fall into certain classic traps that distort their view of financial reality. Fortunately, knowing these pitfalls well is the best way to avoid them and ensure the accuracy of your steering.
One of the most common mix-ups, by far, is mistaking revenue for profit. It’s true that high revenue is encouraging! But on its own, it means nothing until you’ve deducted all your expenses. This is the kind of mistake that can push you to spend a bit too quickly, believing you have funds that are, in fact, already earmarked for your suppliers or the tax authorities.
Omitting real expenses
In the rush of daily business, it’s easy to forget to record certain expenses. Taken individually, they seem trivial, but their accumulation ends up painting a far too optimistic picture of your profitability. For your income statement example to match reality, you need to track down these small outflows.
Here are some of the most commonly forgotten expenses:
- Your own social contributions: For a sole trader, this is often the biggest expense category after purchases of goods or raw materials. Failing to anticipate them means exposing yourself to a very unpleasant cash-flow surprise a few months later.
- Bank fees: Account maintenance, card payment commissions, transfers… These small line items, month after month, end up eating into your margin.
- Depreciation: Did you buy a high-performance computer or a vehicle for your business? That’s an investment. Its annual loss in value is an expense (depreciation) that absolutely must appear in your accounts to give a fair picture of the situation.
- Small everyday expenses: That €15-a-month software subscription, that coffee offered to a client… it seems negligible. But add it all up over a year, and you’ll see these “little nothings” can easily add up to several hundred euros.
Forgetting expenses, even the smallest ones, creates an illusion of profitability. The reality check is often brutal, when you realize the money in the bank account doesn’t match the calculated profit at all. That’s when difficulties paying suppliers or taxes begin.
Misclassifying expenses
Another very common mistake is misfiling an expense. Imagine classifying a purchase of goods (an operating expense) under non-recurring expenses. The result? Your analysis of your core business’s performance is completely distorted. In that case, it’s impossible to correctly calculate your trading margin and know whether your business is truly viable.
Similarly, confusing an expense (the annual maintenance of your car) with an investment (the purchase of that same car) muddies the waters for analysis. Keep in mind that well-organized bookkeeping isn’t just an administrative formality; it’s the foundation that lets you make the right decisions for your business. Rigorous tracking, even a simple one, is your best protection against these costly mistakes.
Automatically generate your income statement with Bizyness
Now that we’ve broken down the theory and seen a few concrete examples, you probably have a better grasp of why the income statement matters. But let’s be honest: preparing it by hand remains a chore, a source of potential errors and, above all, a waste of precious time. This is exactly where automation changes the game for entrepreneurs like you.
Imagine: no more spending hours gathering your invoices and checking your bank statements. Tools like Bizyness were built for exactly that. They turn this accounting headache into a simple formality. Basically, you connect your business bank account, and the app takes care of retrieving and categorizing your transactions on its own.
Moving from a fog of numbers to a clear financial report
The real advantage is centralization. Every invoice issued through Bizyness, every expense recorded, every synced bank transaction… it all feeds your bookkeeping in real time. The tool is smart enough to tell the difference between a stock purchase and a software subscription, or between a service sale and financial income.
This built-in intelligence puts an end to the risk of misclassification, one of the most classic mistakes that completely distorts your view of profitability. It’s simple: the system sorts everything for you, following the accounting structure we’ve walked through together.
The result? A clear report, generated effortlessly.
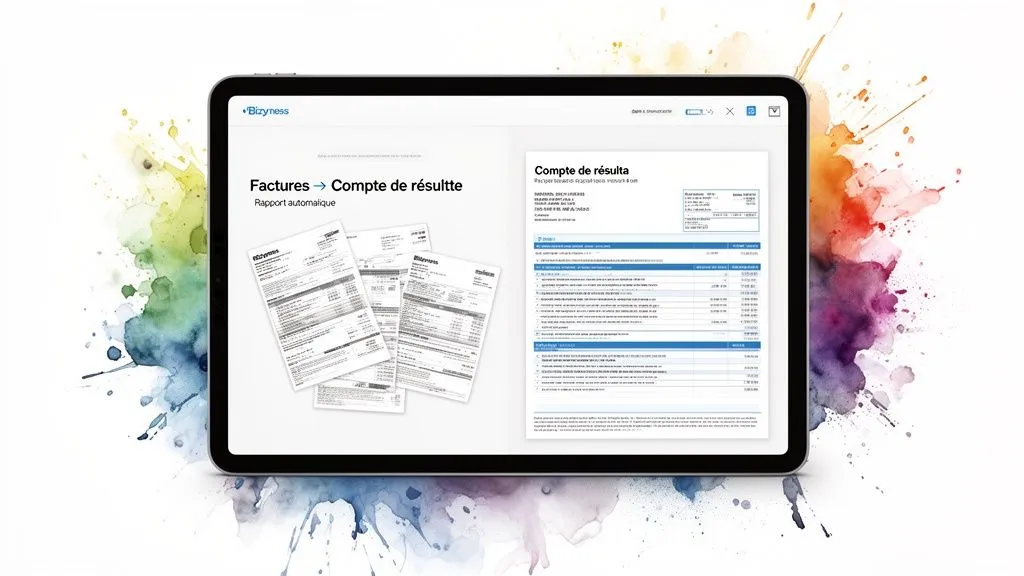
This type of dashboard gives you an instant overview of your performance, without you having to enter a single line manually.
Free up time for what really matters
At its core, the value of automation goes well beyond simply producing an impeccable income statement. The real treasure is the time you save. Instead of drowning in paperwork and numbers, you can finally focus on what moves your business forward: analysis and strategic decisions.
Automation turns the income statement from a document you endure, often tedious and backward-looking, into a genuine dashboard for steering your business in real time. You’re no longer passive in the face of your numbers, you use them to anticipate.
This agility is vital for a small business. Having an up-to-date income statement in a few clicks changes everything. It lets you:
- React quickly: You immediately spot a drift in your costs and can correct course before it’s too late.
- Seize opportunities: You know exactly whether your current profitability allows you to launch that new ad campaign or hire someone.
- Gain peace of mind: No more last-minute stress. Your accounting documents are always ready and compliant.
Simply put, solutions like Bizyness make high-level financial management accessible to everyone. If you’re interested, take a look at the different financial reports available on Bizyness to see how you could simplify your life. This will let you focus on your real job: growing your business.
Your questions about the income statement, answered
Even after seeing an income statement example, a few questions may remain. Let’s go through the most common ones so this document holds no more secrets for you.
What’s the difference with the balance sheet?
Picture your business. The income statement is the film of its activity over a given period. It tells the story of how, month after month, your sales (revenue) stacked up against your expenses to result in a profit or a loss.
The balance sheet, on the other hand, is a snapshot at a given moment. It freezes the situation to show what your business owns (assets) and what it owes (liabilities). One doesn’t go without the other: the film (income statement) explains how you arrived at the snapshot (balance sheet).
Does a sole trader have to prepare one?
From a purely legal standpoint, the answer is no. The micro-entrepreneur regime simplifies your life with reduced bookkeeping obligations: a revenue register and a purchase register are enough.
But be careful, don’t stop there. Creating an income statement, even a very simplified one, is an excellent idea. It’s the only real way to check whether your business makes money once everything is paid. Your revenue alone will never tell you that.
How often should you look at it?
Officially, you must produce an income statement at least once a year, when closing your accounts. But between us, waiting a year to take your business’s pulse is far too long.
For fine-grained, responsive steering, look at it much more often. Ideally, pull it up every month or, failing that, every quarter. This lets you spot right away if something is off and correct course without waiting to see the damage at year-end.
Stop fighting with your spreadsheets. With Bizyness, your financial reports are generated automatically, in just a few clicks.
Try Bizyness for free today
