

 Français
Income statement table: a simple guide to steering your business
Discover the income statement table to analyze your financial performance and optimize your business management. Click to learn more!

Why the income statement table is your best steering ally
Running your business without regularly checking your income statement is a bit like driving a car blindfolded. You can move forward, but the risk of running off the road is high. This key document does more than list your revenues and expenses. It tells the financial story of your activity over a given period, showing you whether your efforts are actually translating into success.
Unlike the balance sheet, which is a snapshot of your assets at a given moment, the income statement table is more like a film. It captures your economic performance over the months or the year. It’s much more than an administrative obligation; it’s a real GPS to guide your strategic decisions.
Measuring the value your business creates
The primary purpose of the income statement is to answer a fundamental question: is your business creating value? It precisely measures the enrichment (or depletion) generated by your activity. It lets you understand not only whether you’re making money, but above all how.
This detailed analysis helps you distinguish profits from your core business from those stemming from financial decisions or one-off events. It’s this clarity that turns a simple list of numbers into a powerful diagnostic tool.
To illustrate how this data is analyzed on a larger scale, here’s an overview of the financial information published by the Banque de France. This example shows how financial institutions assess overall performance, an approach you can fully apply to your own business to track your trajectory.
A decision-making and communication tool
Beyond simple measurement, the income statement table is an essential steering instrument. It concretely helps you to:
- Identify profitability levers: By analyzing your cost structure relative to your revenue, you quickly spot the areas to act on to improve your margins.
- Validate your commercial strategy: Your revenue is growing, but are your profits following the same curve? The income statement gives a clear answer to this crucial question.
- Communicate with your partners: Whether to negotiate a bank loan, reassure investors, or present a solid financial picture, a clear income statement is your best argument.
Comparing your performance against your industry is also a very instructive practice. For example, Banque de France statistics show that the net income of French industrial companies grew at an average annual rate of 3.5% through 2023. Positioning your own numbers relative to these trends gives you valuable context to assess your performance.
Mastering how to read this document is therefore a decisive step toward better calculating the key elements of your financial security and taking control of your growth.
Decoding every line like an expert: complete anatomy of the document
To truly grasp the health of your business, you need to know how to read the income statement table line by line, a bit like an investigator examining every clue in a case. Each item, far more than a mere number, tells one facet of your performance. This structure, although standardized, proves full of insights once you master its codes.
The infographic below illustrates the key relationship between the three pillars of the income statement: revenue, expenses, and net income.
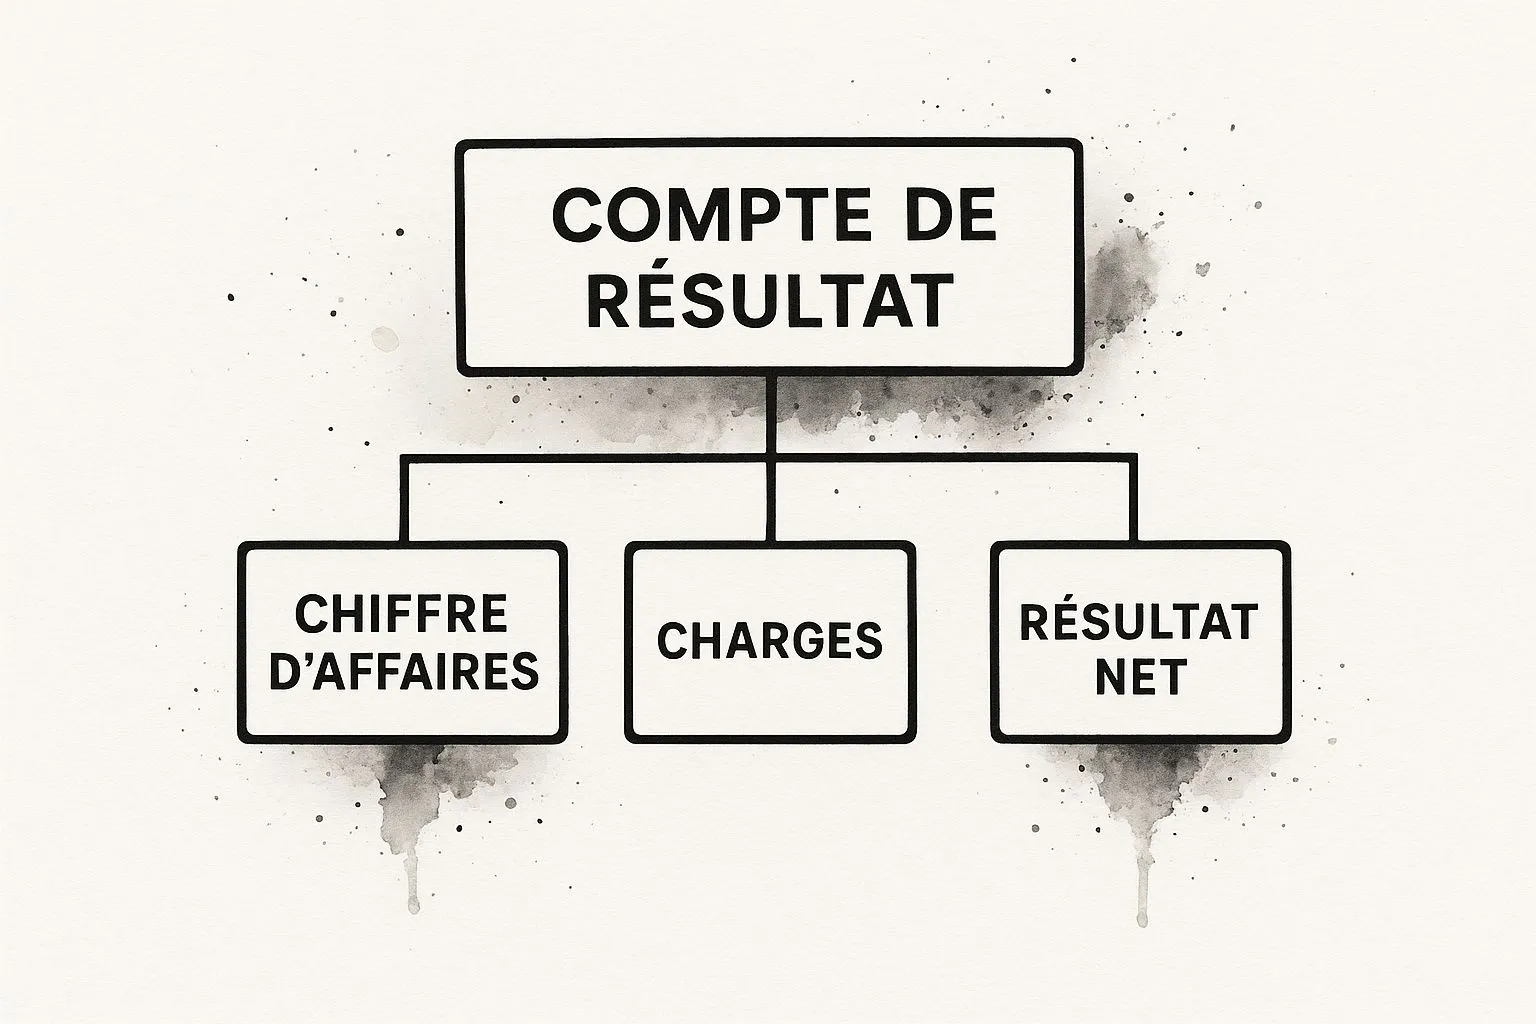
This simple diagram shows how the final result flows from the confrontation between what the business takes in and what it spends. It’s the balance between these two forces that defines the financial soundness of your activity.
Revenue: the fuel for your economic engine
The first major category to look at is revenue. Think of it as everything that feeds the company’s finances. The central element is of course turnover, corresponding to your sales of goods or services. It’s the direct reflection of your commercial success.
However, revenue isn’t limited to that. It also includes other income sources that can play a significant role:
- Operating subsidies: Financial aid you receive to support your day-to-day activity.
- Financial income: Interest you earn on financial investments.
- Extraordinary income: One-off gains, such as the sale of an asset (a vehicle, a machine) at a price above its book value.
By analyzing this section, you can determine whether your business relies solely on its sales or draws on other income to support its growth.
Expenses: the costs necessary to create value
Opposite revenue, we find expenses. These represent everything your business must spend to operate and generate its income. It’s the price to pay to turn your resources into sellable products or services. They’re classified into several categories, each shedding light on a different aspect of your management.
- Operating expenses: These are the costs directly tied to your core activity. They include purchases of raw materials, salaries and payroll costs for your teams, rent, and utility bills.
- Depreciation and amortization charges: Often a source of confusion, this line represents the “loss of value” of your equipment over the year. It’s an expense that doesn’t correspond to a cash outflow, but it’s essential to reflect the wear of your production tools.
- Financial expenses: Mainly the interest you pay back on your loans.
- Extraordinary expenses: Unforeseen costs, such as penalties or losses on insolvent customers.
To help you see things more clearly, here’s a table detailing the typical structure of an income statement and the importance of each section.
Detailed structure of the income statement table
Comparison of the different sections of the income statement, their meaning, and their impact on the analysis
| Section | Items included | Impact on analysis | Average percentage of revenue |
|---|---|---|---|
| Operating revenue | Turnover, capitalized production, subsidies | Measures the company’s ability to generate revenue through its core activity. | 100% (calculation base) |
| Operating expenses | Purchases, external costs, salaries, taxes, depreciation and amortization | Indicates the direct cost of the activity. A rapid increase can signal a loss of efficiency. | 60% - 85% |
| Operating income | Difference between operating revenue and operating expenses | Assesses core-business performance, independent of financing policy. | 5% - 15% |
| Financial result | Financial income (interest received) minus financial expenses (interest paid) | Reflects the impact of the financing strategy (debt, investments) on profitability. | Varies widely |
| Extraordinary result | Income (asset sales) minus extraordinary expenses (fines) | Isolates non-recurring events so they don’t distort the analysis of current performance. | Highly variable, often close to 0% |
| Corporate tax | Amount of tax owed on profits | Shows the tax burden on the business. | About 25% of pre-tax income |
| Net income | Sum of all results (operating, financial, extraordinary) minus tax | The final figure that measures profit or loss. What’s left for shareholders. | 2% - 10% |
This table shows that each section has a specific function. Analyzing operating income is often the most important step, since it judges the pure performance of the activity, without the influence of financial decisions or one-off events.
The final relationship between your revenue and your expenses will determine whether you post a profit or a loss. Understanding the nature and weight of each line is the first step toward making informed decisions and improving your business’s profitability.
The indicators that reveal your real performance
Your income statement is far more than a simple list of revenue and expenses. It’s a genuine trove of information that, once analyzed, reveals the real performance of your business. Beyond net income, several key indicators, known as intermediate management balances, act like warning lights on your dashboard. Each sheds light on a specific aspect of your activity.

Gross margin: the pulse of your commercial efficiency
Think of gross margin as the first vital sign of your sales engine. It’s calculated by subtracting the purchase cost of goods sold (or the production cost) from your revenue. This indicator directly measures the efficiency of your sales or production process. A high gross margin percentage means you’re selling your products or services well above their direct cost, a clear sign of good health.
EBITDA: your ability to generate cash
If gross margin measures efficiency, EBITDA (earnings before interest, taxes, depreciation, and amortization) measures the strength of your business model. It represents the gross resource generated by your operating cycle, before taking into account investment decisions (depreciation) and financing decisions (financial expenses). It’s the potential cash flow created by your core business. Solid EBITDA proves your activity is viable and capable of funding its growth, repaying its debts, and rewarding its capital providers.
Operating income: the pure performance of your activity
Operating income goes a bit further. It starts from EBITDA and deducts depreciation, amortization, and provisions. It thus assesses the pure performance of your core activity, factoring in the wear of your production tools. It’s the indicator analysts scrutinize to judge a company’s intrinsic profitability, independent of its financing choices or one-off events.
To help you see things more clearly, here’s a summary table of the key financial ratios that can be calculated from the income statement.
Essential financial ratios of the income statement
Overview of the main ratios calculated from the income statement, with their formulas and interpretation thresholds.
| Ratio | Calculation formula | Interpretation | Reference threshold |
|---|---|---|---|
| Gross margin rate | (Gross margin / Revenue excl. VAT) x 100 | Percentage of revenue retained after deducting direct costs. Reflects commercial or production efficiency. | Varies widely by industry (e.g., > 70% for software, 20-40% for large-scale retail). |
| EBITDA margin rate | (EBITDA / Revenue excl. VAT) x 100 | The company’s ability to generate cash from its core activity. Measures gross operating profitability. | A rate above 15% is often considered good, but it depends on the industry. |
| Operating margin rate | (Operating income / Revenue excl. VAT) x 100 | Profitability of the company’s core activity after accounting for equipment wear (depreciation). | A rate above 10% is generally a sign of good performance. |
| Net margin rate | (Net income / Revenue excl. VAT) x 100 | Measures the company’s final profitability after all expenses, including interest, taxes, and extraordinary items. | Varies greatly, but a rate above 5-10% is often seen positively. |
This table shows how each ratio offers a different perspective. Comparing these ratios over time and against your industry is essential practice for a meaningful analysis.
These intermediate balances, although centered on operations, are complemented by the financial result. This can have a significant impact. For example, INSEE data for 2022 shows that non-financial market companies in France generated a positive financial result of nearly 29,110.5 million euros, thanks to financial income exceeding expenses. This statistical overview, which you can explore further via the detailed statistics on sector profitability on the INSEE website, underscores the importance of analyzing every layer of the result.
Ultimately, net income brings together all these layers (operating, financial, extraordinary) and corporate tax to deliver the final verdict. But without a solid understanding of the indicators that make it up, this figure alone doesn’t tell the whole story. Tracking these balances lets you steer your business better, and you can discover other essential performance indicators to round out your analysis.
Turning your data into winning decisions: mastering the art of comparison
Looking at an income statement table on its own is a bit like watching a single frame of a film: you see one scene, but you miss the whole plot. The true value of this tool shows up when you start comparing data. Putting numbers into perspective is how you turn a simple accounting read into a powerful lever for strategic decision-making. A well-conducted comparison is the key to identifying underlying trends, assessing your real performance, and positioning yourself against the competition.
Horizontal analysis: tracking your evolution over time
The first, and most instinctive, approach is to compare your current income statement with those from previous periods (year N-1, N-2, etc.). This is called horizontal analysis. It lets you trace the evolution of each line: did your revenue grow by 5% or by 20%? Did your payroll costs grow faster than your revenue?
This time-based view highlights dynamics that would remain invisible looking at a single fiscal year. Strong revenue growth may seem positive, but if it’s driven by soaring customer acquisition costs, your profitability could actually be deteriorating. Conversely, a temporary dip in income may simply reflect a significant strategic investment that will create value in the future.
To give this analysis more depth, it’s useful to look at sector data. INSEE, for example, publishes detailed information on company accounts by industry. These publications let you measure your own trajectory against that of your market, offering essential context for judging your performance.
Vertical analysis: dissecting the structure of your costs
Vertical analysis, for its part, looks at the structure of your income statement over a single period. The idea is to express each line as a percentage of revenue. For example:
- Purchases of goods: 40% of revenue
- Payroll costs: 25% of revenue
- Operating income: 10% of revenue
This method reveals the composition of your costs and the structure of your margins. It answers fundamental questions: what proportion of every euro you take in is absorbed by your raw materials? What share is left to cover other costs and generate a profit?
Comparing this structure from one year to the next, or with your industry’s averages, is particularly illuminating. It helps you quickly spot cost overruns or opportunities for improvement. If you want to dig deeper into building effective reports, our article on building a financial dashboard with concrete examples can offer useful pointers.
Avoiding deadly traps: common mistakes and practical solutions
Even with a well-presented income statement table, it’s easy to fall into certain interpretation traps. These misunderstandings can be costly, as they distort the reality of your financial situation. By learning to recognize these common errors, you’ll be able to sharpen your analysis and make much safer decisions for your business’s future.

Trap #1: confusing profit with cash
This is undoubtedly the most common mistake, but also the most dangerous. Your income statement may show an attractive profit, but that doesn’t mean you have that amount in your bank account. Why? Simply because this document includes expenses that aren’t cash outflows (like depreciation and amortization) and income that hasn’t yet been collected (invoices your customers haven’t paid yet).
- The paradox: A business can be perfectly profitable on paper yet struggle badly to pay its salaries or suppliers.
- The solution: Never rely solely on net income. To get an accurate picture of your financial health, always supplement your analysis with a look at your actual cash position, for example using a projected cash flow plan.
Trap #2: neglecting extraordinary items
The income statement clearly distinguishes between operating income, financial result, and extraordinary result. The latter, as the name suggests, concerns events that don’t recur, such as the sale of a warehouse or an unexpected tax fine. The mistake is including it in the assessment of your day-to-day performance.
- The paradox: Net profit artificially inflated by a one-off asset sale can mask the fact that your core business is actually running at a loss.
- The solution: Focus your attention first on operating income. This is the indicator that measures the true performance of your core business. Always set extraordinary items aside when judging the sustainable profitability of your business model.
Trap #3: ignoring the impact of accounting choices
The way you record certain transactions can change the picture your income statement presents. For example, choosing to depreciate a new piece of equipment more quickly will increase your expenses and therefore reduce your short-term profit. These choices are perfectly legal, but you need to be aware of them.
Similarly, accounting standards can change over time, which complicates comparisons if you’re not paying attention. The switch to the 2014 base for France’s national accounts, for example, changed how certain flows are measured. To learn more, you can check the INSEE information on this methodological revision.
- The paradox: Two perfectly identical companies could report different net results, simply because of the accounting options they’ve chosen.
- The solution: When comparing your results from one year to the next, check that no accounting method changed in between. If it did, you’ll need to “restate” the figures so your comparison stays fair and relevant.
Three real businesses, three analyses, three master lessons
Theory is fine, but nothing beats analyzing real cases to truly grasp the nuances of the income statement table. To see how this tool adapts to different realities, let’s look at the day-to-day operations of three businesses with very different profiles. These examples will help you better interpret your own numbers.
Case #1: The startup “TechNova” on the rise
TechNova is a young software company investing heavily to grow. A glance at its income statement shows explosive revenue growth, with a +150% jump in one year. Yet its net income remains in the red.
- The key signal: Payroll costs and R&D expenses eat up 70% of operating expenses. This is a classic scenario for a company betting everything on innovation and market share conquest, even at the cost of short-term profitability.
- The lesson to remember: For a startup, negative net income isn’t necessarily alarming if it stems from strategic investments that build the future. The indicator to watch closely is the ratio between customer acquisition cost and lifetime value (LTV/CAC), which reveals whether the growth strategy is sustainable.
Case #2: The SME “ManuSolide” facing inflation
ManuSolide is an SME that manufactures metal parts. Its income statement table shows stable revenue, but its operating income dropped from 8% to 3% in just two years.
- The warning signal: A closer analysis reveals that “raw material purchases” rose from 45% to 55% of revenue. The company is directly hit by rising steel costs and is struggling to pass this increase on to its selling prices.
- The lesson to remember: In manufacturing, gross margin is an essential barometer of financial health. If it erodes, that’s an alarm signal requiring immediate action. The solution often involves a two-pronged approach: renegotiating supplier contracts and adjusting pricing policy to protect profitability.
Case #3: The consulting firm “ServiPro”
ServiPro is a B2B services company operating in a highly competitive market. Its revenue is only growing modestly (+5%), but its net margin has improved significantly, rising from 6% to 9%.
- The positive signal: The “payroll cost to revenue” ratio dropped by three points. This indicates the company has optimized its internal processes. Its consultants are now able to handle more projects without headcount growing proportionately.
- The lesson to remember: In service businesses, operational efficiency is the main driver of profit. Analysis of the income statement table should therefore focus on productivity ratios per employee to properly steer the company’s performance.
Your action plan to become a financial analysis expert
Turning your income statement from a simple administrative formality into a genuine dashboard for your strategic decisions is entirely possible. The secret? Don’t just read it. Learn to actively question it and make analyzing it a regular management habit. Here’s a roadmap to help you get there.
Plan your analyses on a strategic rhythm
Financial analysis isn’t a one-off task, but an ongoing process. By adopting a precise schedule, you ensure you never fly blind and always stay on course toward your goals.
- Every month: Time for a quick check-in. Compare your actual results with your projected budget. Is your revenue on track with expectations? Are your direct costs under control? This is the perfect moment for quick adjustments and course corrections.
- Every quarter: Time to dig a little deeper. Calculate your main intermediate management balances (gross margin, EBITDA, operating income) and compare them to previous quarters. This broader view helps you spot underlying trends before they become major problems.
- Every year: Conduct a comprehensive analysis. Assess your company’s performance over the full fiscal year, compare your figures to your industry’s averages, and set the major financial goals for the year ahead.
Adopt the right tools and best practices
For this process to run smoothly and effectively, it’s wise to rely on proven methods and tools designed to make your life easier.
- Automate calculations: Use management software or spreadsheets to set up dashboard templates. You’ll save considerable time and reduce the risk of human error in tracking your key indicators.
- Create checklists: For each type of analysis (monthly, quarterly), draw up a list of points to review. This systematic approach ensures you never miss anything important and cover every angle.
- Communicate clearly: Let your numbers speak. When presenting your findings to your teams or partners, use simple charts and focus on 3 or 4 major takeaways. Explain what the numbers concretely mean for the business and what actions you’re proposing as a result.
By following this plan, the income statement will become a genuine ally. It will no longer be a mere static document, but a dynamic guide steering your decisions toward profitable, well-managed growth.
To further simplify this process and automate the generation of your reports, discover how Bizyness can become the co-pilot of your financial management.
