

 Français
Sample forecast balance sheet: concrete template and practical guide
Sample forecast balance sheet: discover a concrete template and a guide to assess your project's financial viability and attract investors.
A sample forecast balance sheet is a bit like a snapshot of your future company’s wealth, except taken in advance. In concrete terms, it’s a numerical simulation detailing everything the company will own (its assets) and everything it will owe (its liabilities) at a given point in time, usually at the close of its first accounting periods.
What is a forecast balance sheet actually for?
Forget the idea that a forecast balance sheet is just an administrative box to tick in your business plan. It’s actually the financial roadmap of your project, a concrete projection of your future company’s health. Unlike a standard balance sheet, which is a kind of rear-view mirror on the past year, the forecast version forces you to look straight ahead.

Its role is crucial, whether you’re just starting out or in the middle of a growth phase. This exercise forces you to put numbers behind your strategy, which is essential to:
- Validate the soundness of the project: It proves that your business model holds up. By checking that assets (what you have) are properly financed by liabilities (where the money comes from), it confirms your company’s foundations are solid.
- Anticipate funding needs: The balance sheet highlights your funding needs, whether to launch or to grow. You’ll know precisely how much starting capital is required and whether a loan will be unavoidable to buy equipment, for example.
- Make better decisions: Should you invest in new machinery? Is it better to dip into your own funds or take out a loan? The forecast balance sheet gives you tangible data to settle these strategic questions.
A strong argument to win people over
Beyond its value to you, the forecast balance sheet is your best ally when talking with outside partners. It’s the document your banker or potential investors will pore over to judge the seriousness and credibility of your project.
A well-built, consistent, and balanced statement is a genuine sign of trust. It shows you know where you’re going and drastically increases your chances of securing funding.
Simply put, mastering your forecast balance sheet proves you have a clear, quantified vision of the future. You’re not flying blind; you’re steering your company with a precise map in hand.
This document doesn’t exist in isolation. It’s closely tied to the other financial statements, such as the forecast income statement or the cash flow plan. Together, these elements make up your financial forecast and provide a 360° view of your company’s expected performance and structure.
The structure of the balance sheet: assets and liabilities, how does it work?
To put together a forecast balance sheet that holds up, you first need to understand how it’s built. Picture a simple two-pan scale: assets on one side, liabilities on the other. These two columns must always balance out.
It’s a bit like a snapshot of your company’s wealth at a given moment. Assets are everything your company owns. Liabilities show how it all gets financed.
This distinction is crucial. Assets list the resources you control that will generate value. Liabilities, on the other hand, detail where the money came from to acquire those resources. Perfect balance (Assets = Liabilities) isn’t just an accountant’s quirk; it’s proof that your financial model is coherent.
On the assets side: what your company owns
Assets, then, are all the property and rights that hold value for your business. To make things clearer, they’re split into two main families: fixed assets and current assets.
Fixed assets are everything built to last, things you won’t be selling off tomorrow morning.
- Intangible fixed assets: These are assets you can’t physically touch. Think of a business you buy out, a patent you file, or the development costs of your own software.
- Tangible fixed assets: This is the concrete stuff. IT equipment, machinery, company vehicles, office furniture… anything physical.
- Financial fixed assets: This can be shares you buy in another company or the security deposit you pay to rent your premises.
Next comes current assets. These are in constant motion. They cover everything that will be transformed or sold during your operating cycle, generally within less than a year. This includes:
- Inventory, whether raw materials to be transformed or finished goods ready for sale.
- Accounts receivable, i.e. the money your customers owe you. This is the total amount of invoices you’ve sent that haven’t yet been paid.
- Cash, quite simply. This is the money immediately available in your bank accounts or in the till.
And on the liabilities side: how is all this financed?
Liabilities are the other side of the mirror. They explain where the money came from to finance everything just listed under assets. This is just as important a section, as it reveals your project’s financial strength and level of debt. It’s split into two parts: equity and debt.
Equity represents “in-house” funds. This is money that truly belongs to the company, contributed by the partners or generated by the business itself. It’s a stable resource and a sign of good health.
It includes the initial contribution (share capital), profits from previous years that you’ve kept in the company (reserves), and of course, the current year’s result. Trust me, solid equity reassures a banker enormously.
Finally, there’s debt, i.e. outside resources you’ll eventually need to repay. It’s generally split into two categories:
- Financial debt: This mainly covers medium- or long-term bank loans taken out to finance major investments.
- Operating debt: These are day-to-day debts tied to your business. This includes unpaid supplier invoices (accounts payable) or social security contributions and taxes owed (social and tax liabilities).
To help you see things more clearly, here’s a summary of the key line items to keep in mind.
Summary of asset and liability line items
This table summarizes the key elements to include in your forecast balance sheet, illustrated with examples for each item.
| Category | Accounting item | Concrete example |
|---|---|---|
| ASSETS | Fixed assets | |
| Intangible fixed assets | Purchase of a business, filing a patent, software. | |
| Tangible fixed assets | Computers, production machinery, delivery vehicle. | |
| Financial fixed assets | Security deposit for a commercial lease, guarantee. | |
| Current assets | ||
| Inventory | Merchandise stock for an e-commerce store, raw materials. | |
| Accounts receivable | Invoices issued and awaiting payment. | |
| Cash | Business bank account balance, cash on hand. | |
| LIABILITIES | Equity | |
| Share capital | Cash or in-kind contribution from partners at incorporation. | |
| Reserves | Undistributed profits from previous years. | |
| Result for the year | Profit or loss for the current year. | |
| Debt | ||
| Financial debt | Bank loan for purchasing equipment. | |
| Accounts payable | Supplier invoice for raw materials, due within 30 days. | |
| Social and tax liabilities | VAT payable, URSSAF social security contributions due. |
Properly classifying each item is the foundation of a reliable balance sheet. If you’re unsure how to allocate an expense or a resource, our guide on the general chart of accounts is there to help you see things clearly and assign the right account to each transaction.
Building your forecast balance sheet step by step
Building your forecast balance sheet is the moment when all your ideas and assumptions finally take a concrete, quantified shape. Far from being a mere accounting exercise, it’s the financial translation of your business vision. To get there, we’ll build on the work already done in your business plan, particularly the funding plan and the forecast income statement.
The idea is simple in principle: list and value everything your company will own (assets) and, opposite that, everything that will finance those assets (liabilities). The key is consistency. Every figure must be realistic and justifiable.
Quantifying the asset items
We start with assets, i.e. where your money goes. This is the “uses” column. To fill it in, simply go through the list of all your needs, whether for the launch or day-to-day operations.
-
Tangible fixed assets: These are your very tangible investments. Think of all the essential equipment: computer, company vehicle, machinery, furniture… For your figures to hold up, base them on real quotes. For example, for an e-commerce site, you might budget €2,500 for IT equipment and €1,500 to fit out a small storage area.
-
Opening inventory: If your business involves selling products, you need to estimate the value of your initial stock. A consultant probably won’t have anything to put here, but an online clothing store could easily start with €10,000 worth of merchandise.
-
Accounts receivable: This is simply the money your customers owe you at a given point in time. You need to estimate the amount of invoices that won’t yet have been paid by year-end. Imagine annual revenue of €100,000 with an average payment term of 30 days. Your accounts receivable would then be around €8,333 (i.e. €100,000 / 12 months).
The diagram below sums up this logic nicely. It contrasts what the company owns (assets) with how it was funded (liabilities).
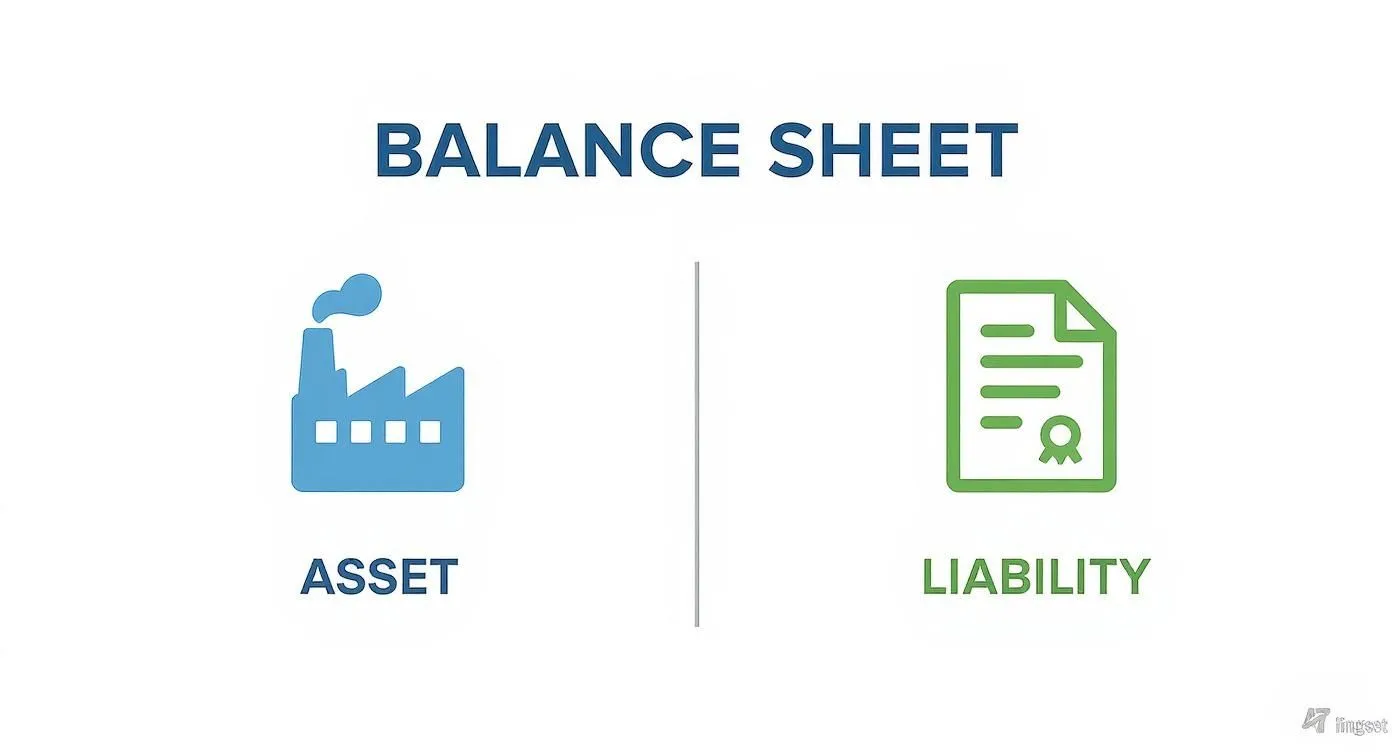
This image is a reminder of a golden rule in accounting: perfect balance. Every euro invested in assets must have a clearly identified source in liabilities.
Assessing the liabilities items
Now let’s move to the other side of the mirror: liabilities. This part explains where the money comes from. These are the “resources” that finance the assets we just listed.
Building the liabilities side is a bit like the moment of truth. This is where you check whether you actually have the funds needed to cover all the needs identified in assets. Get this wrong, and the whole project can become shaky.
Let’s see how to value the main items:
-
Share capital: This is the initial stake, the money you and your partners inject into the company. Its amount must be sufficient to reassure partners and cover part of the initial expenses. For a service business, capital of €5,000 can be a credible starting base.
-
Bank loans: If your personal contributions aren’t enough (which is often the case), this is where you record the loan you plan to obtain. Note that you record the capital still to be repaid at year-end, not the initial amount.
-
Result for the year: Simply take the figure calculated in your forecast income statement. If you make a profit, it boosts your equity. In case of a loss, it reduces it. That’s the logic.
-
Accounts payable: This is the mirror image of accounts receivable. It’s the amount of invoices you’ll still owe your suppliers at the end of the year.
Ensuring the final balance
The final check is to make sure the fundamental equation holds: Total Assets = Total Liabilities. If the two totals don’t match, that’s a sign of an error somewhere. Most often, the discrepancy is hiding in cash, which acts as the adjustment variable.
By the way, your assumptions need to stay grounded in reality. You don’t start a business in a bubble. Macroeconomic indicators, such as GDP growth (a rise of more than 0.5% per quarter can signal a good time to invest) or the unemployment rate, inevitably influence your business. Similarly, the rise in labor costs, which climbed 1.9% year-on-year in the third quarter of 2025, has a direct impact on your profitability. It’s worth keeping an eye on French economic publications to fine-tune your forecasts.
If your assets are higher than your liabilities, you’re short of money to finance your plans. Conversely, if liabilities exceed assets, you have a surplus of resources that should show up in your cash position (on the assets side). To make life easier and avoid calculation errors, feel free to rely on a forecast balance sheet template. It’s a valuable tool for structuring your approach.
A concrete example: the forecast balance sheet of a consultant
Nothing beats a practical case to make things clearer. To bring the theory to life, let’s step into the shoes of Léa, who is about to launch her independent digital marketing consulting business. This exercise will let us turn her assumptions into real numbers.
Léa is starting on solid ground. She has planned a personal contribution, a small loan to equip herself with quality IT equipment, and she has already worked out her revenue and expenses in her income statement.

Setting the starting assumptions
To build this balance sheet, we’ll rely on fairly standard assumptions for a service business like hers:
- Share capital: Léa puts in €5,000 of her own money to set up her company.
- Bank loan: She tops this up with a €4,000 loan to buy a powerful computer and the necessary software. After one year, she’ll still have €3,000 left to repay.
- Investments (assets): Her IT equipment is therefore recorded as an asset at its purchase value, i.e. €4,000.
- Revenue and expenses: Her forecast income statement projects a net profit of €12,000 after tax for her first year.
These starting figures are the cornerstone of our balance sheet. They directly reflect Léa’s first strategic decisions.
Building the first-year forecast balance sheet
With these elements in hand, we can start filling in the two main columns of Léa’s balance sheet at the end of her first accounting period. The goal? Make sure everything balances perfectly.
Let’s take a look at what that looks like in figures.
This balance sheet is a perfect snapshot of financial balance: total assets (€26,000) exactly match total liabilities (€26,000). This shows that Léa’s project is financially consistent.
On the assets side (what Léa owns)
On the assets side, we logically find:
- Tangible fixed assets: her well-known IT equipment, valued at €4,000.
- Accounts receivable: she anticipates that by year-end, she’ll still have unpaid invoices outstanding, for an amount she estimates at one month of revenue, i.e. €5,000.
- Cash: this is the adjustment variable, the money left in her bank account once everything is paid. Here, she has a tidy €17,000 remaining.
On the liabilities side (where the money comes from)
Liabilities, meanwhile, explain how all these assets are financed:
- Equity: it amounts to €17,000. This is the sum of her starting capital (€5,000) and the profit she generated (€12,000). An excellent indicator of solidity!
- Financial debt: this is simply the capital still left to repay on her loan, i.e. €3,000.
- Accounts payable and social liabilities: she anticipates having €6,000 in expenses still to settle at the start of the following year (URSSAF, taxes, etc.).
Put simply, this balance sheet shows a very healthy financial situation. Léa’s equity is much higher than her debt, and she has a comfortable cash position to weather the unexpected and even fund her growth.
Now, it’s also worth putting these forecasts into context. For example, in France, the share of household budgets spent on housing rose from 24% to 31% between 1959 and 2023. This pressure on purchasing power can spill over into the marketing budgets of the companies Léa is targeting. It’s an external factor worth watching to fine-tune her future revenue forecasts. You can also find more details on the evolution of household consumption at lafinancepourtous.com.
Consider this sample forecast balance sheet as a solid base you can fully adapt to your own project.
How to interpret the figures in your balance sheet
Having a forecast balance sheet that holds up is a first step. But knowing how to read between the lines and understand what the figures say about your project’s future health is what really makes the difference. This document isn’t just a box to tick on a checklist; it’s a genuine dashboard. Properly interpreted, it lets you anticipate hard times and make the right strategic decisions before you’ve even started.
Your sample forecast balance sheet is much more than a simple addition of columns. It reveals the financial balance (or imbalance) of your future company. To see things clearly, let’s look at a few key indicators that flow directly from its structure.
Analyzing financial structure with working capital
The first thing to check is the Net Working Capital (NWC). This indicator is a bit like a thermometer for your financial stability. It simply measures the surplus of your stable resources (your equity and long-term debt) over what you’ve invested in your durable assets (the famous fixed assets).
The formula is very simple:
NWC = Permanent capital - Fixed assets
A positive NWC? That’s an excellent sign. In concrete terms, it means your long-term resources fully finance your long-term investments. Even better, you have a safety margin left to cover part of your day-to-day expenses. Conversely, a negative NWC should raise a red flag. It’s a genuine warning sign: you’re financing long-lasting investments with short-term debt. A very risky situation.
Anticipating cash needs with working capital requirement
The second essential indicator is the Working Capital Requirement (WCR). It represents the amount your company must constantly have on hand to finance the gap between the moment money goes out and the moment it comes in.
Think of it as a permanent need for cash to keep the machine running. You have to pay your suppliers and buy your stock well before you get paid by your customers. The WCR is exactly the money needed to bridge that gap.
It’s calculated as follows:
WCR = Inventory + Accounts receivable - Accounts payable
A high WCR, especially if poorly anticipated, is one of the most common causes of business failure. It’s therefore absolutely crucial to estimate it as precisely as possible. To help you visualize the structure and the different line items, feel free to check out our detailed guide on the balance sheet table.
By analyzing these ratios, you’re not just reading numbers; you’re assessing the soundness of your business model. Your forecasts should also fit into a bigger picture. For example, knowing that INSEE estimates the French population will reach 69.2 million inhabitants by 2040 can influence future demand in many sectors. To go further, you can check out INSEE’s latest demographic projections. This long-term perspective is essential to building a forecast balance sheet that’s truly realistic and relevant.
The questions every entrepreneur has about the forecast balance sheet
Even with the best guide in the world, a few questions often remain before you finalize your file. That’s completely normal. Let’s demystify together the points that might still seem unclear, so you can be perfectly comfortable with your forecast balance sheet.
What’s the actual difference with the forecast income statement?
That’s an excellent question, and the confusion is common. Let’s break it down simply.
The forecast balance sheet is a snapshot of your company’s wealth at a specific point in time, usually December 31. On one side, everything the company owns (its assets: machinery, stock, money in the bank). On the other, everything it owes (its liabilities: accounts payable, loans). It’s a genuine status report on its financial health.
The forecast income statement, on the other hand, is the movie of your company’s activity over a full year. It tracks all your incoming money (revenue) and all your expenses (costs). In the end, it tells you whether you made money (profit) or lost money (loss).
A handy way to remember it: the income statement measures performance (the year’s movie), while the balance sheet measures wealth (the snapshot at the end). The two are inseparable for understanding where you stand.
How often should this balance sheet be updated?
When building your business plan, you typically start with a three-year projection. But once the business is up and running, this document shouldn’t gather dust in a drawer. It becomes a genuine management tool.
An annual update is the bare minimum to compare your forecasts against reality. But to be truly proactive, I’d recommend a quarterly review. It’s the best way to stay on course. That’s even more true if your market moves quickly or an unexpected event occurs, such as a spike in the price of your raw materials.
Can I really do my forecast balance sheet on my own?
The answer is yes, absolutely. Building your own forecast balance sheet is actually an incredibly educational exercise. It forces you to dig into your numbers, challenge your assumptions, and thoroughly master how your business works.
That said, once your version is finalized, an accountant’s input is invaluable. They’ll make sure everything is consistent, realistic, and compliant with expectations. If your goal is to convince a bank or investors, having your balance sheet validated by a professional isn’t optional, it’s a necessity. It’s the stamp of approval that will make your file credible and serious.
Ready to turn your forecasts into a professional document without pulling your hair out? Bizyness simplifies building your forecasts and automates your management so you can focus on what matters most: growing your business. Discover how at Bizyness.fr.
